
CFA考試相關視頻
Point and Interval Estimates of the Population Mean
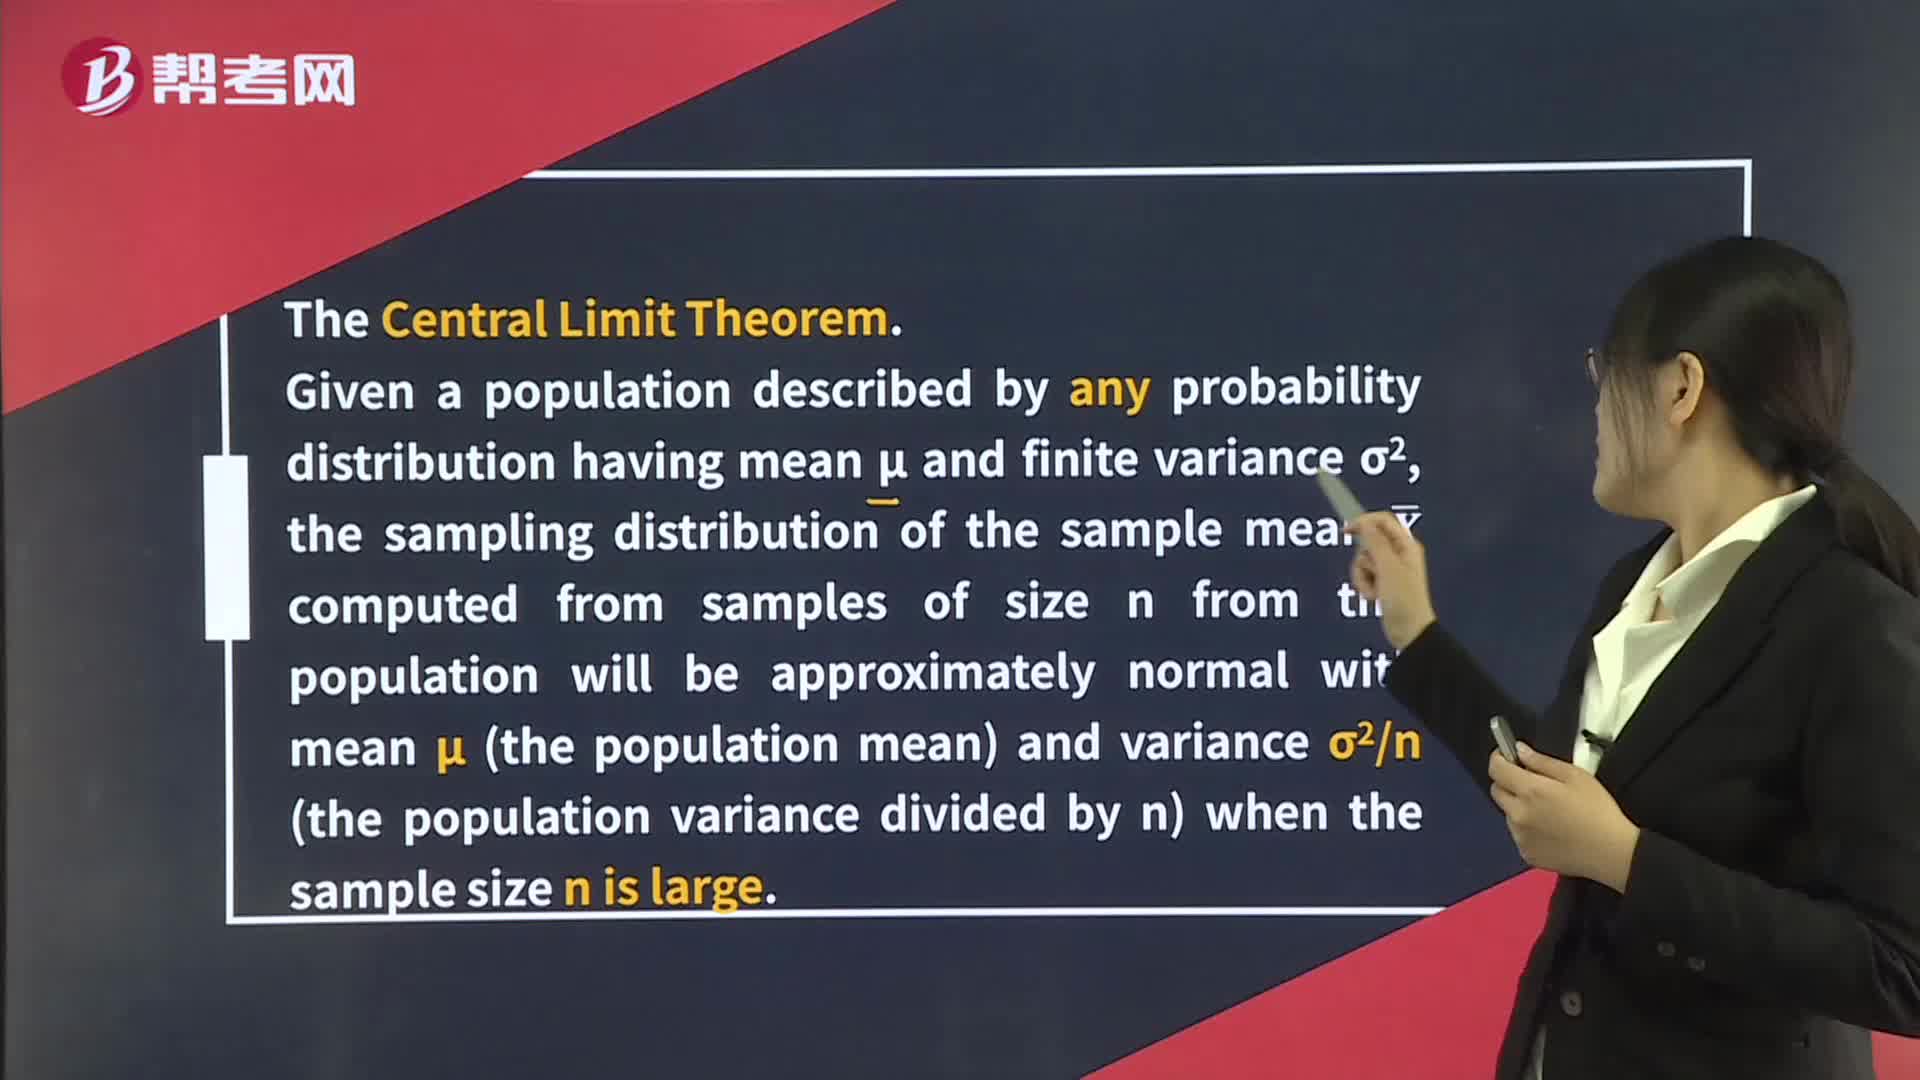
Distribution of the Sample Mean

The Graphic Presentation of Data
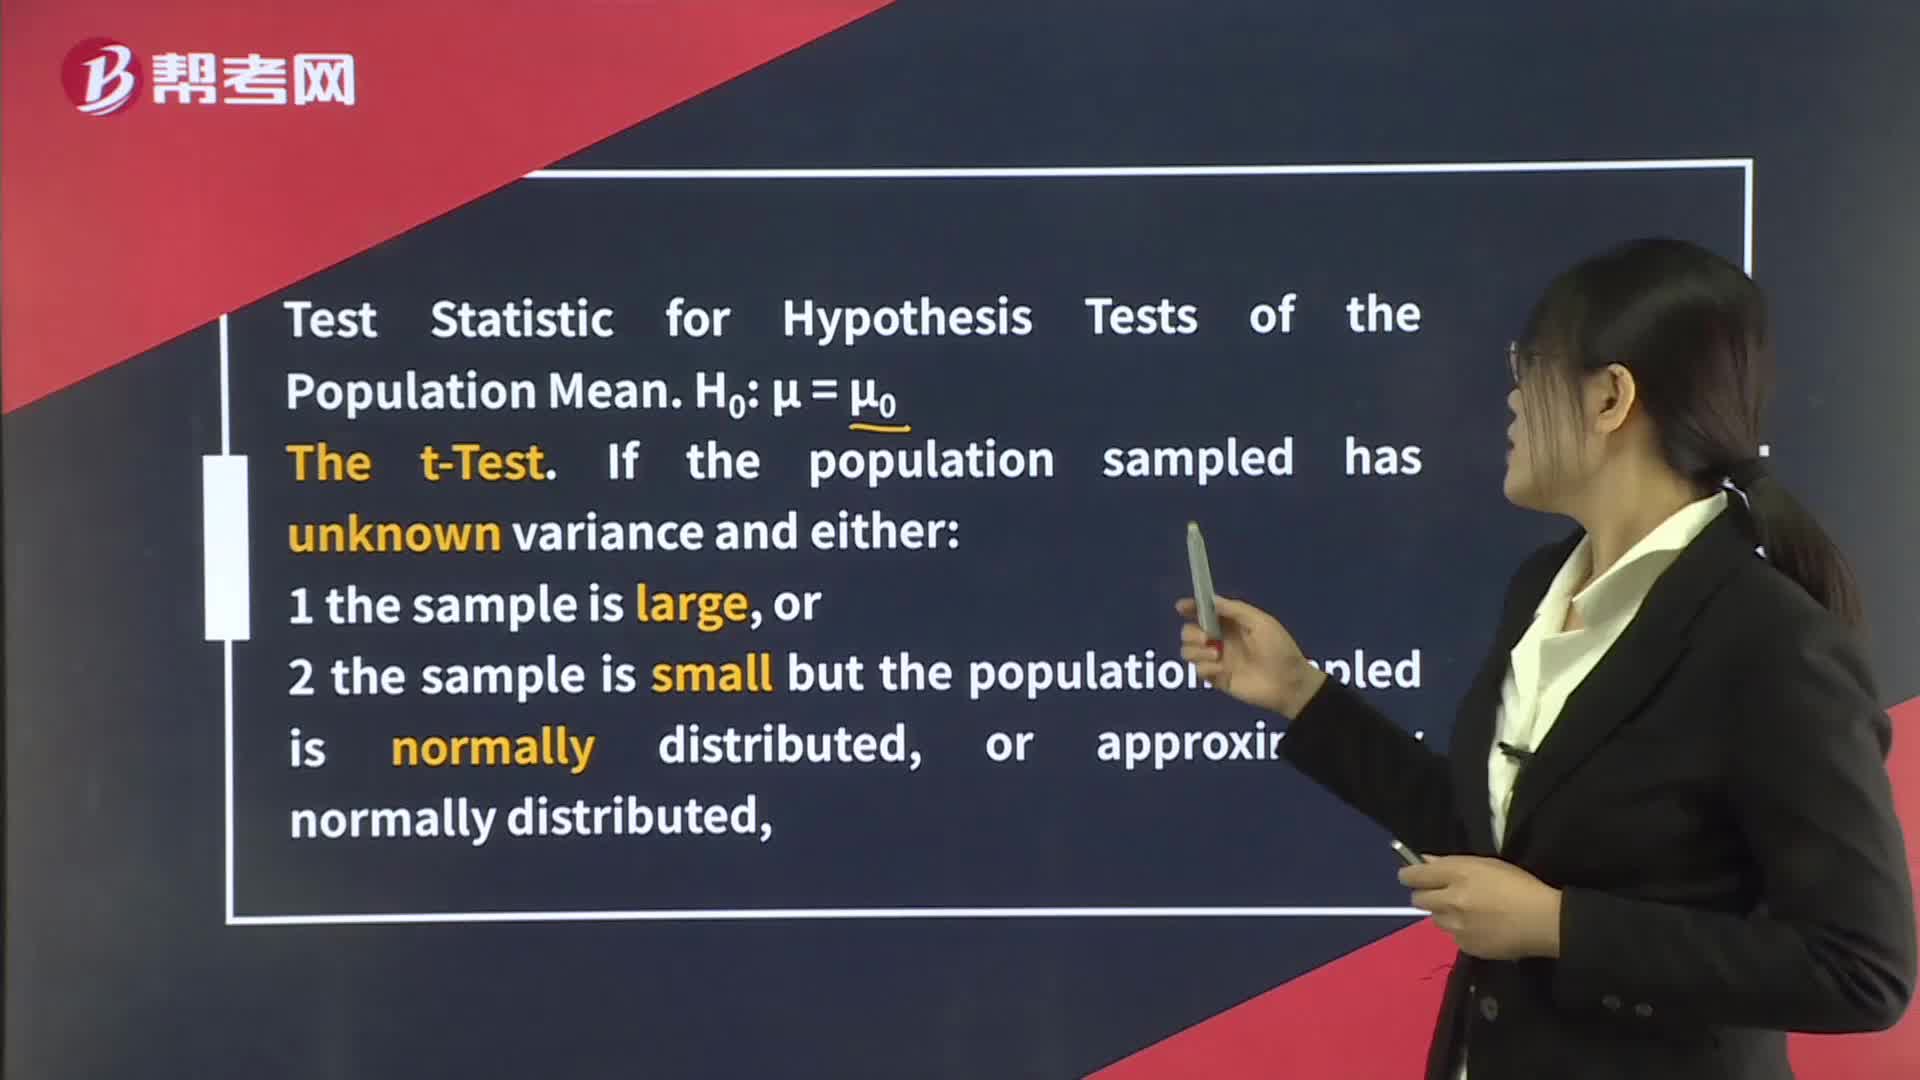
Hypothesis Tests Concerning the Mean
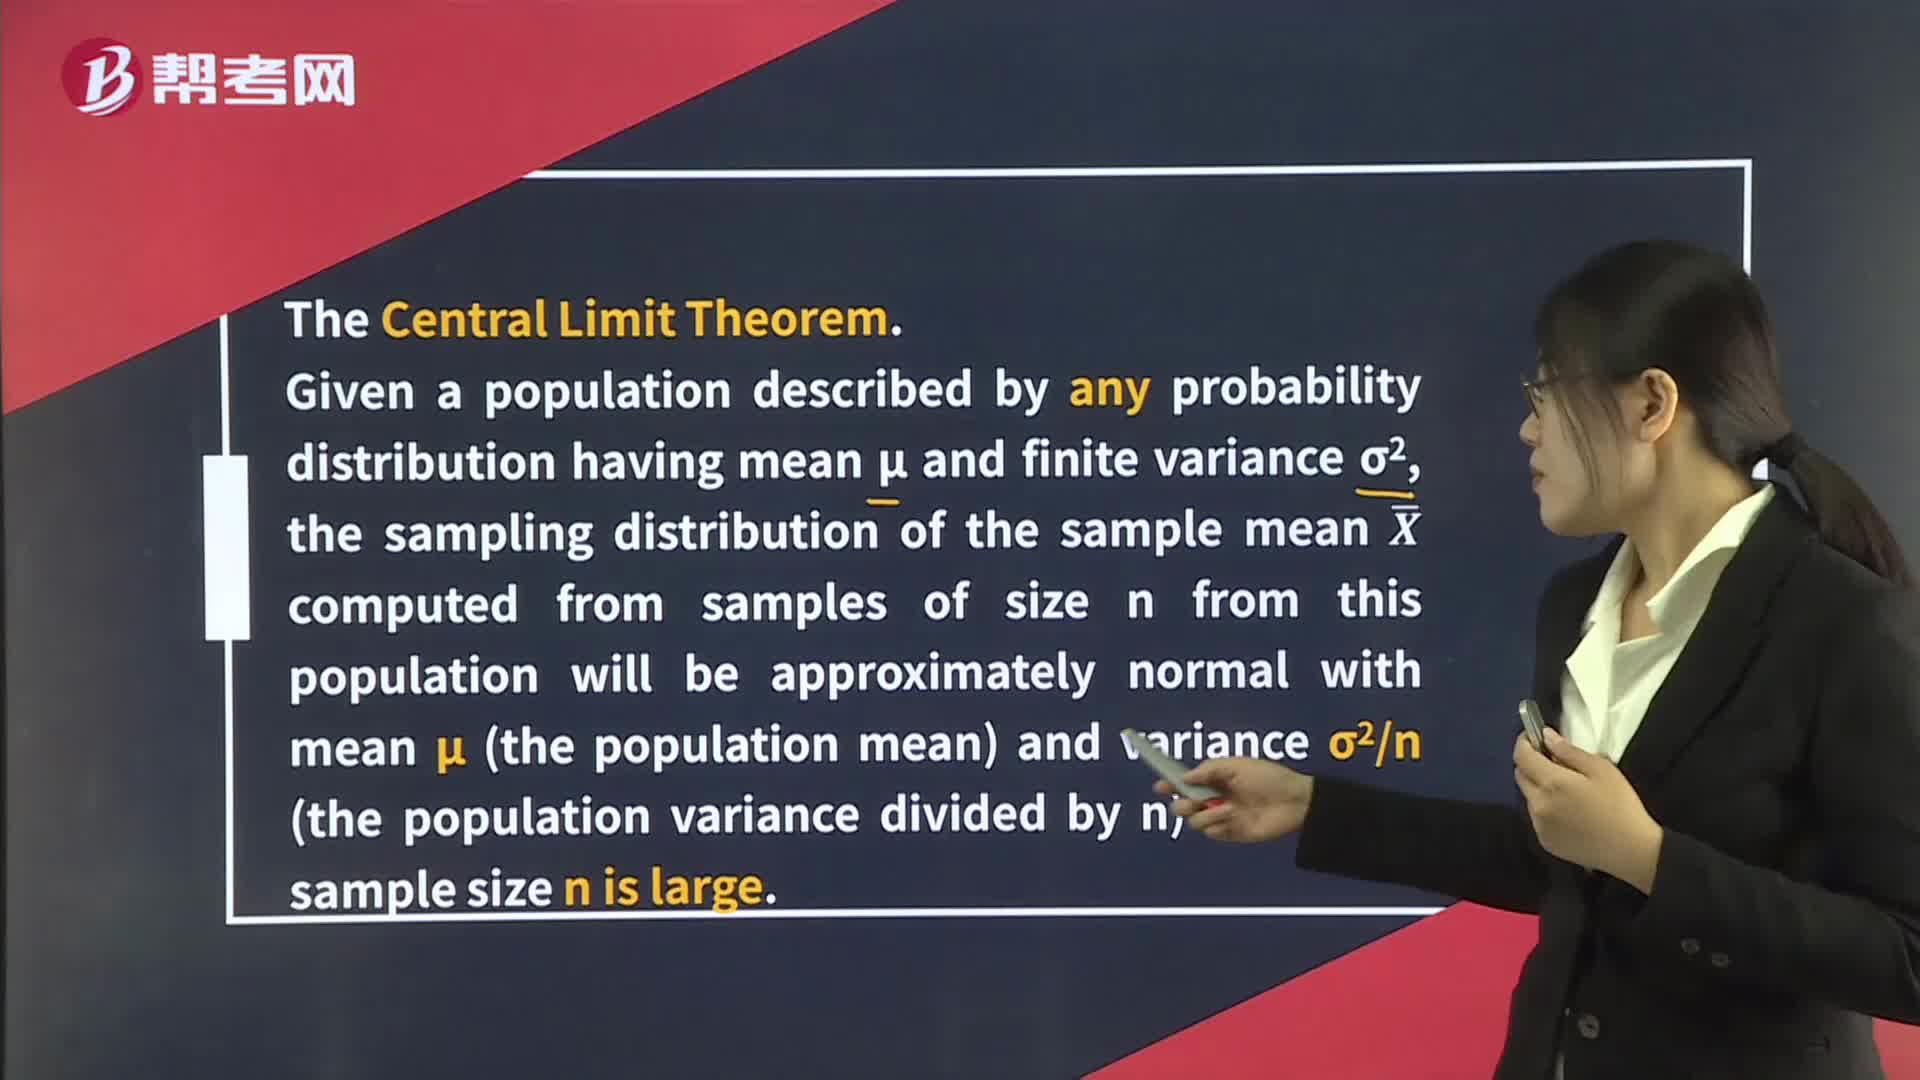
Distribution of the Sample Mean
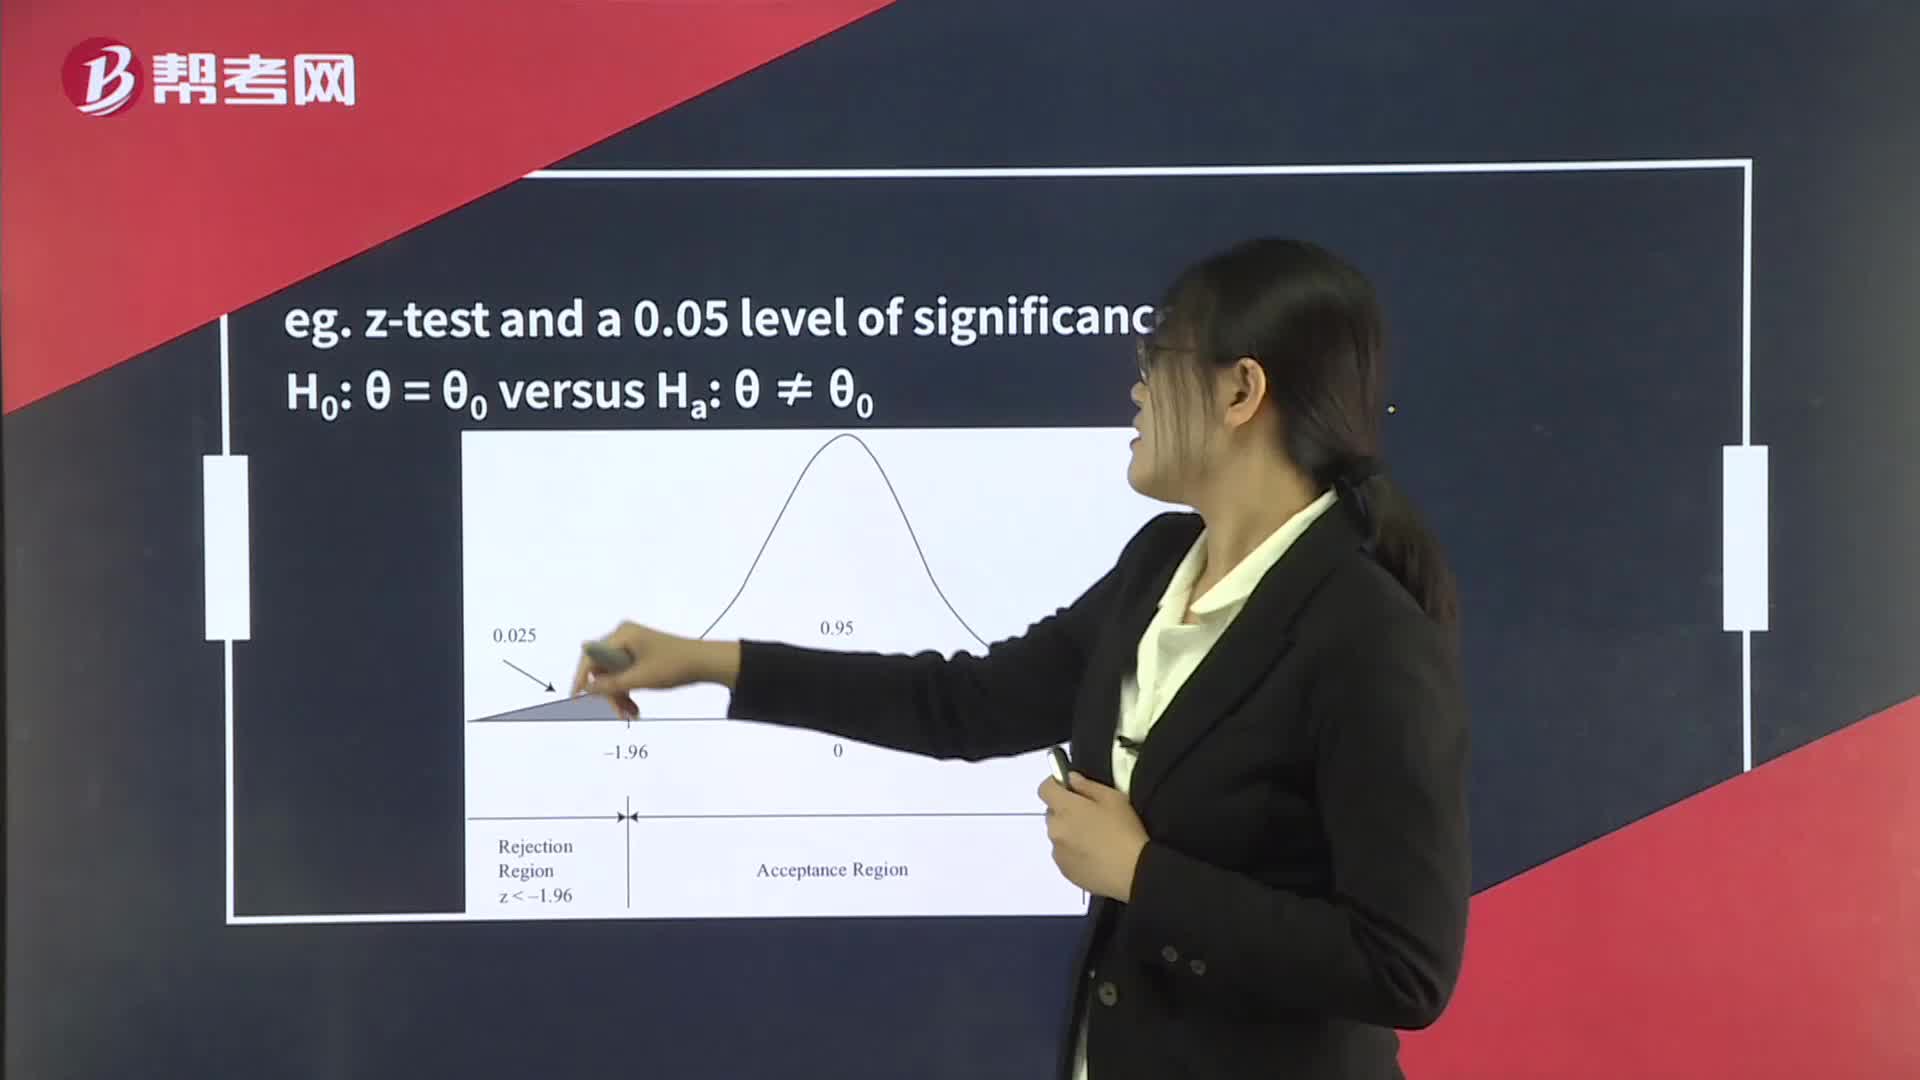
Rejection Point (Critical Value) for the Test Statistic

The Components of GDP
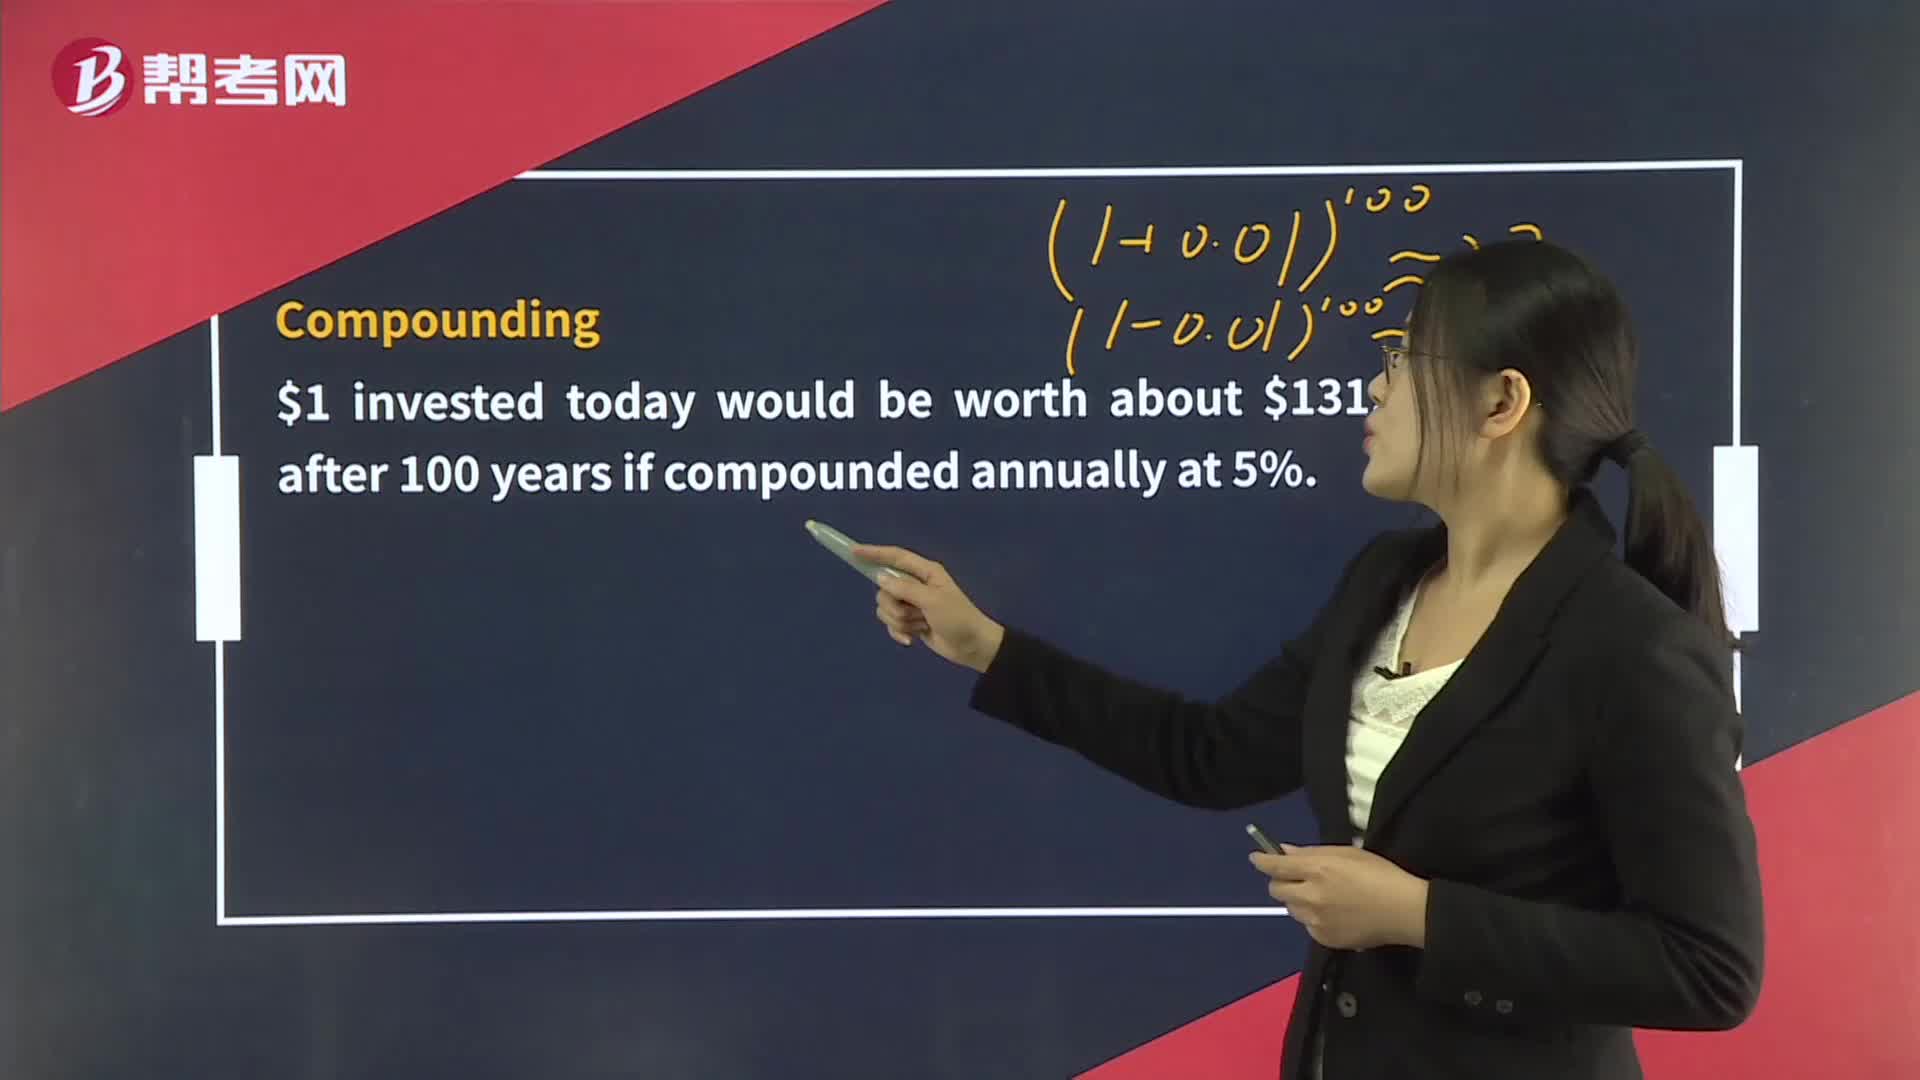
The Time Value of Money
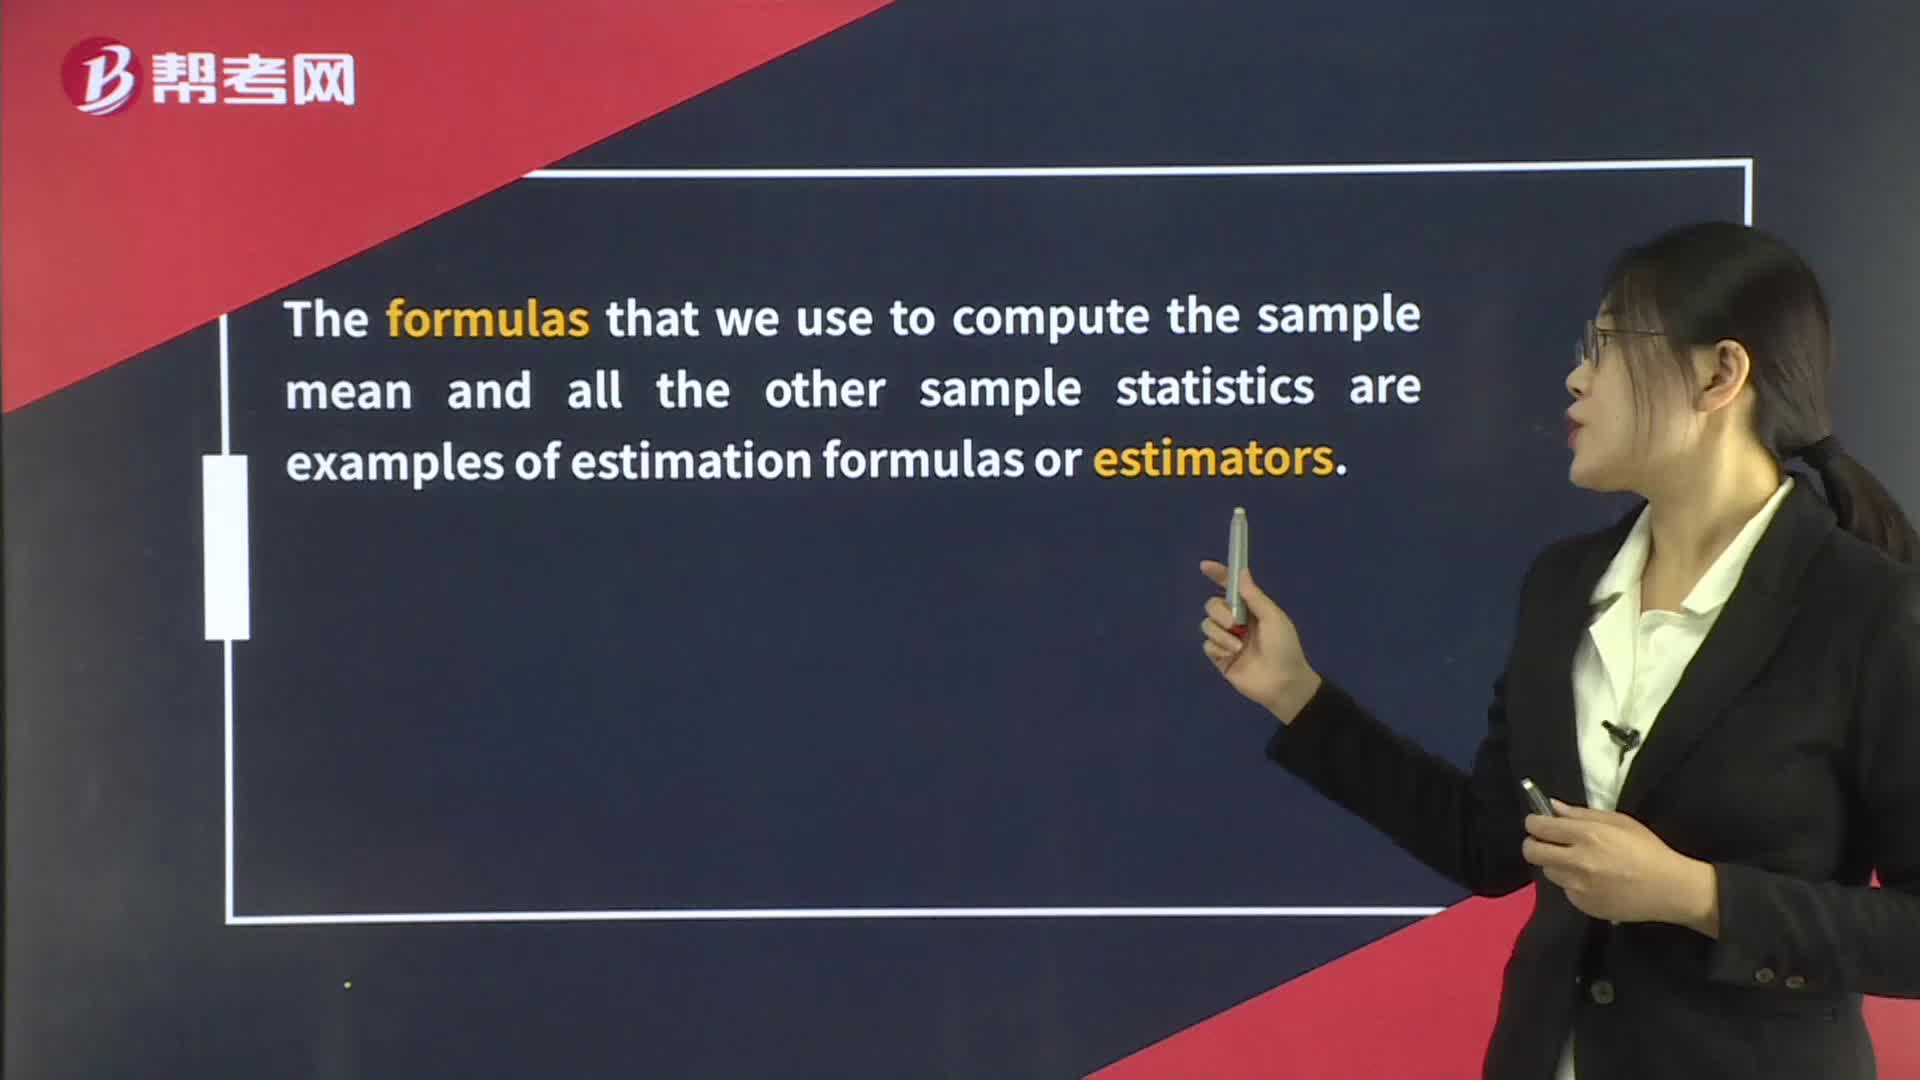
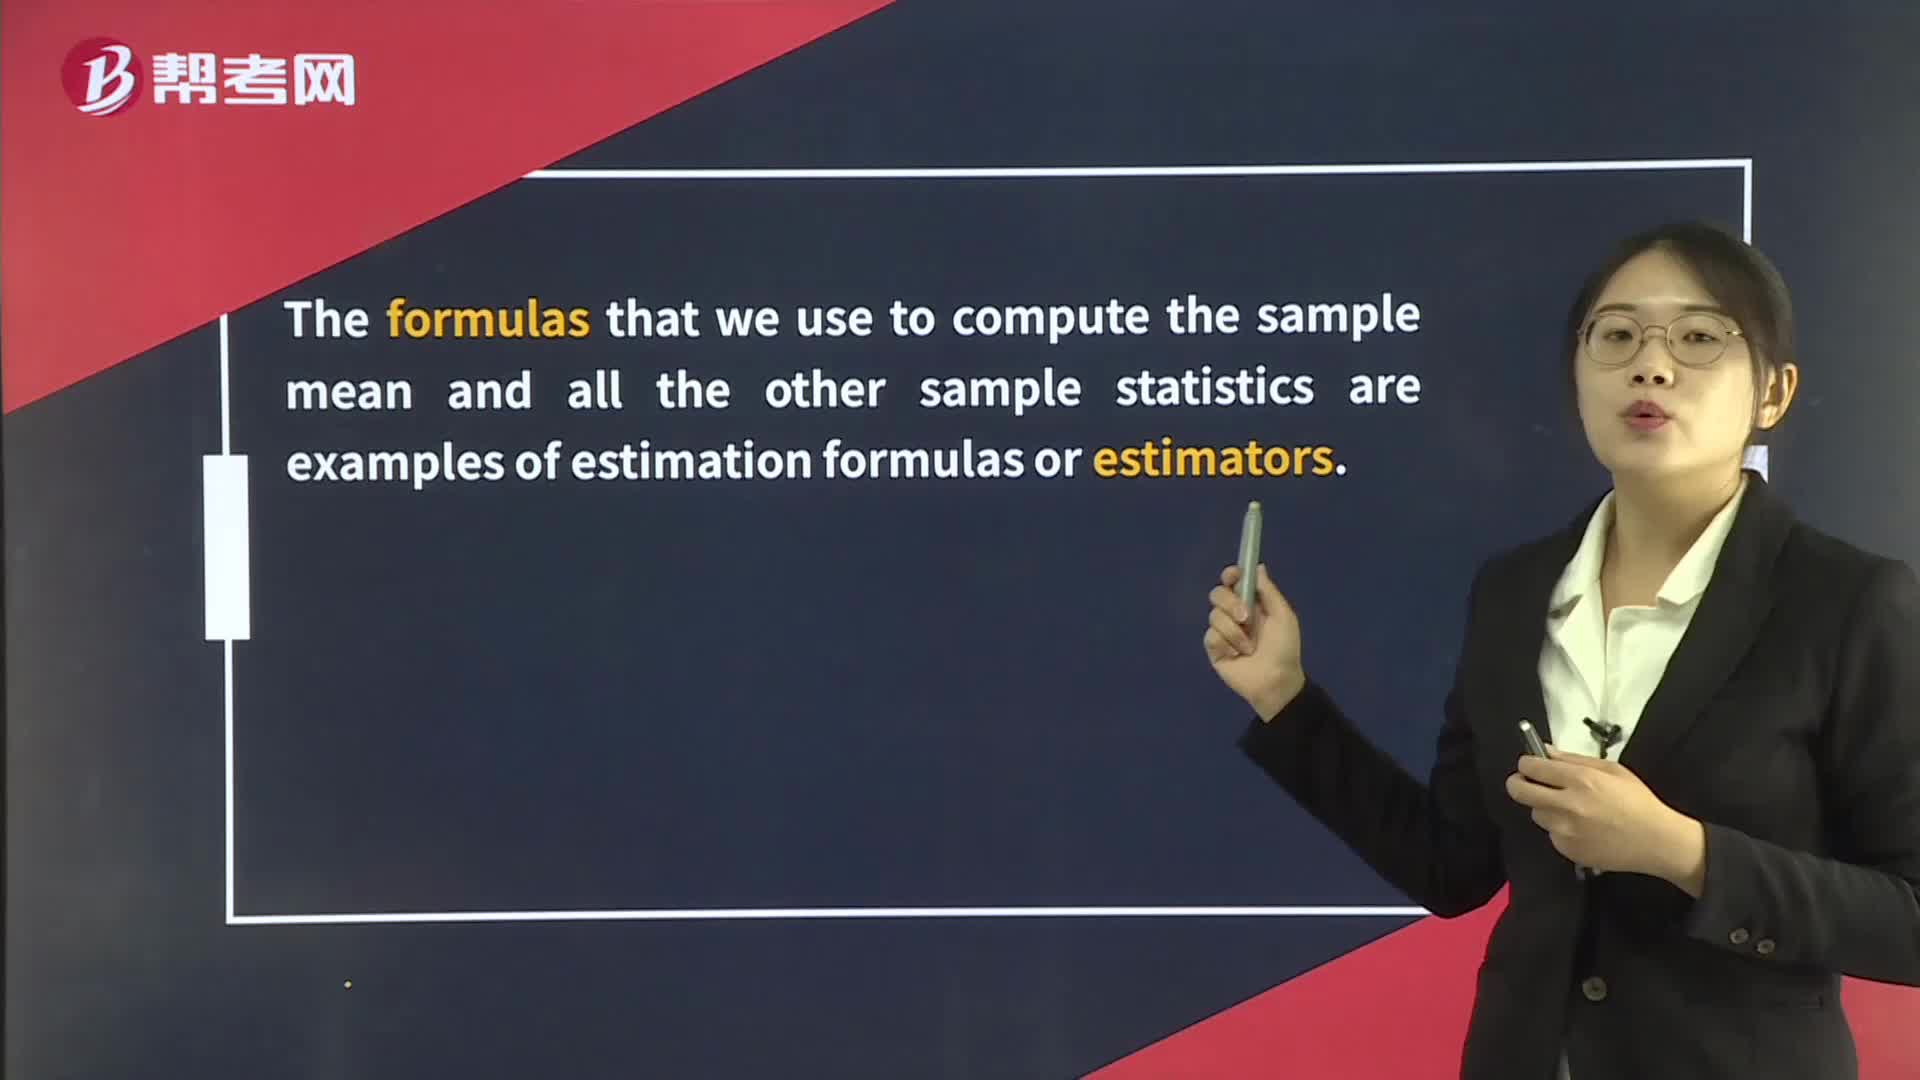
Point and Interval Estimates of the Population Mean
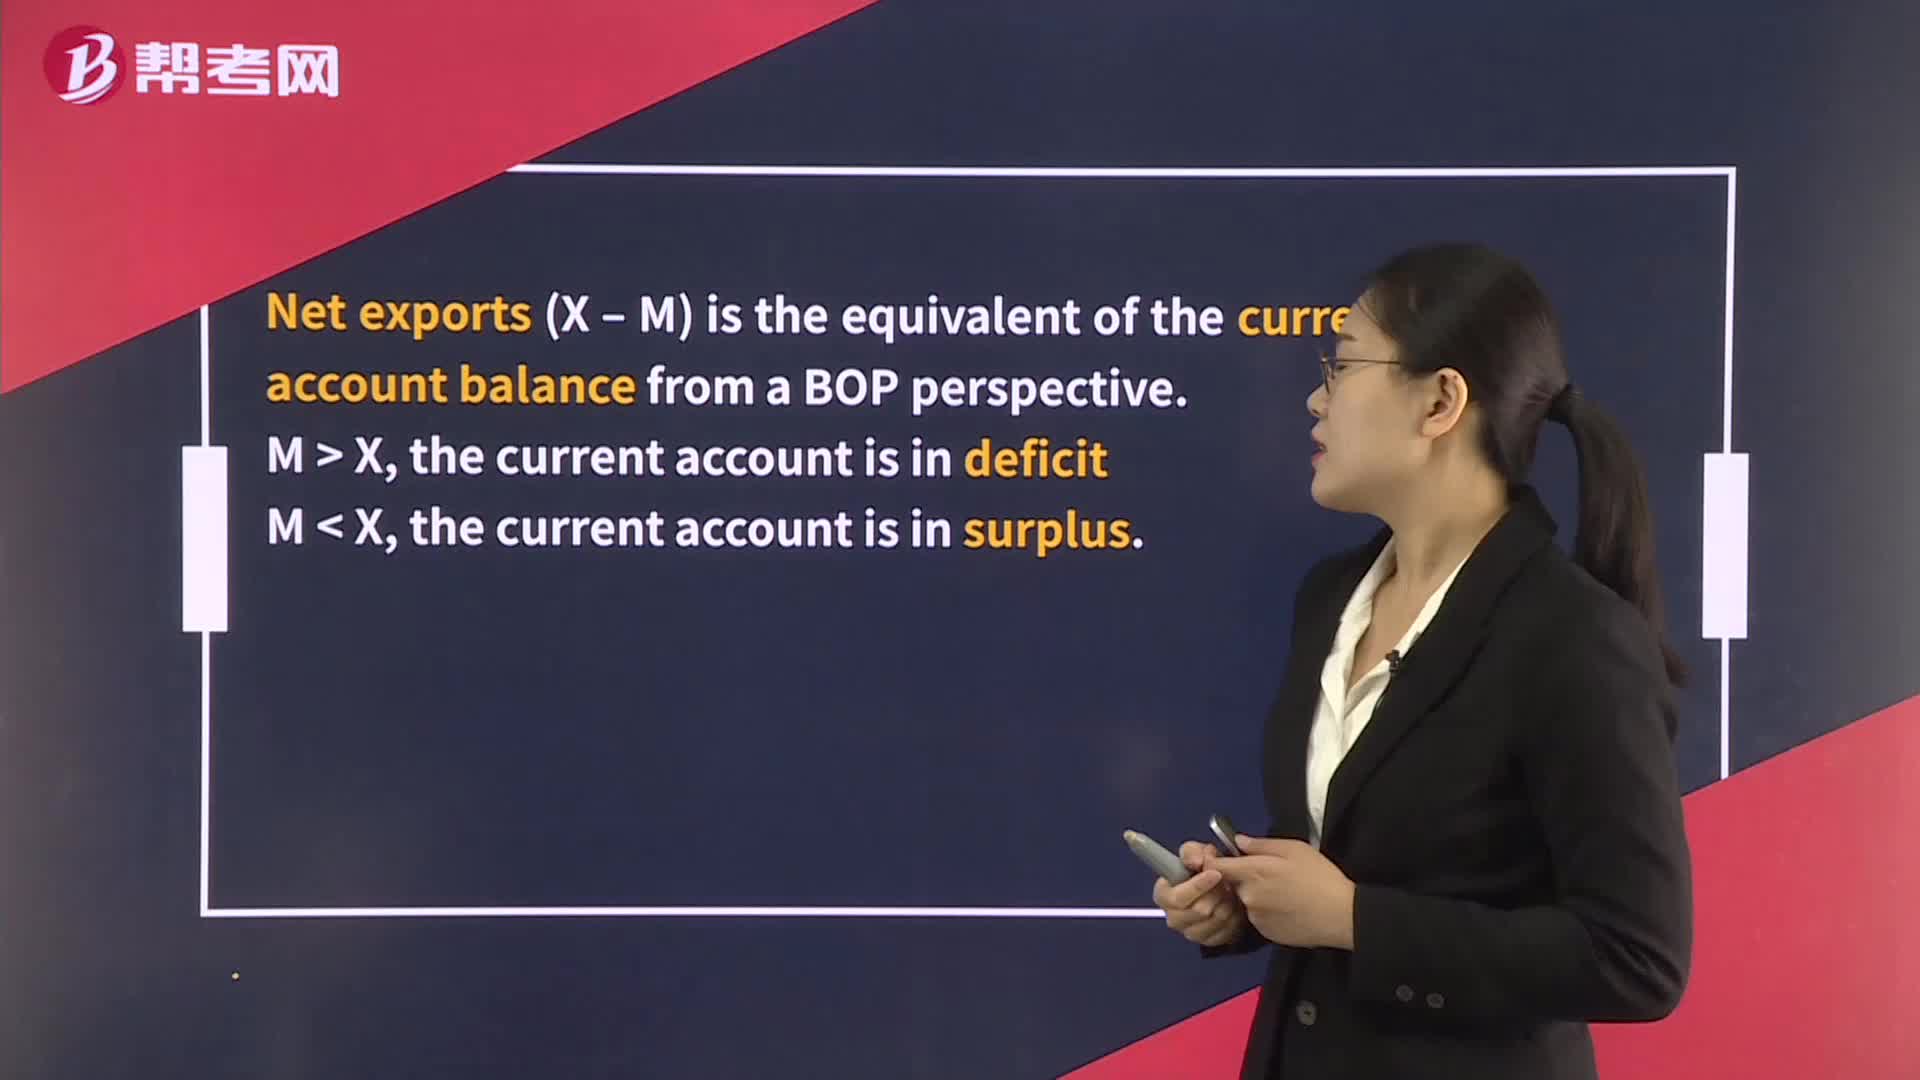
National Economic Accounts and the Balance of Payments
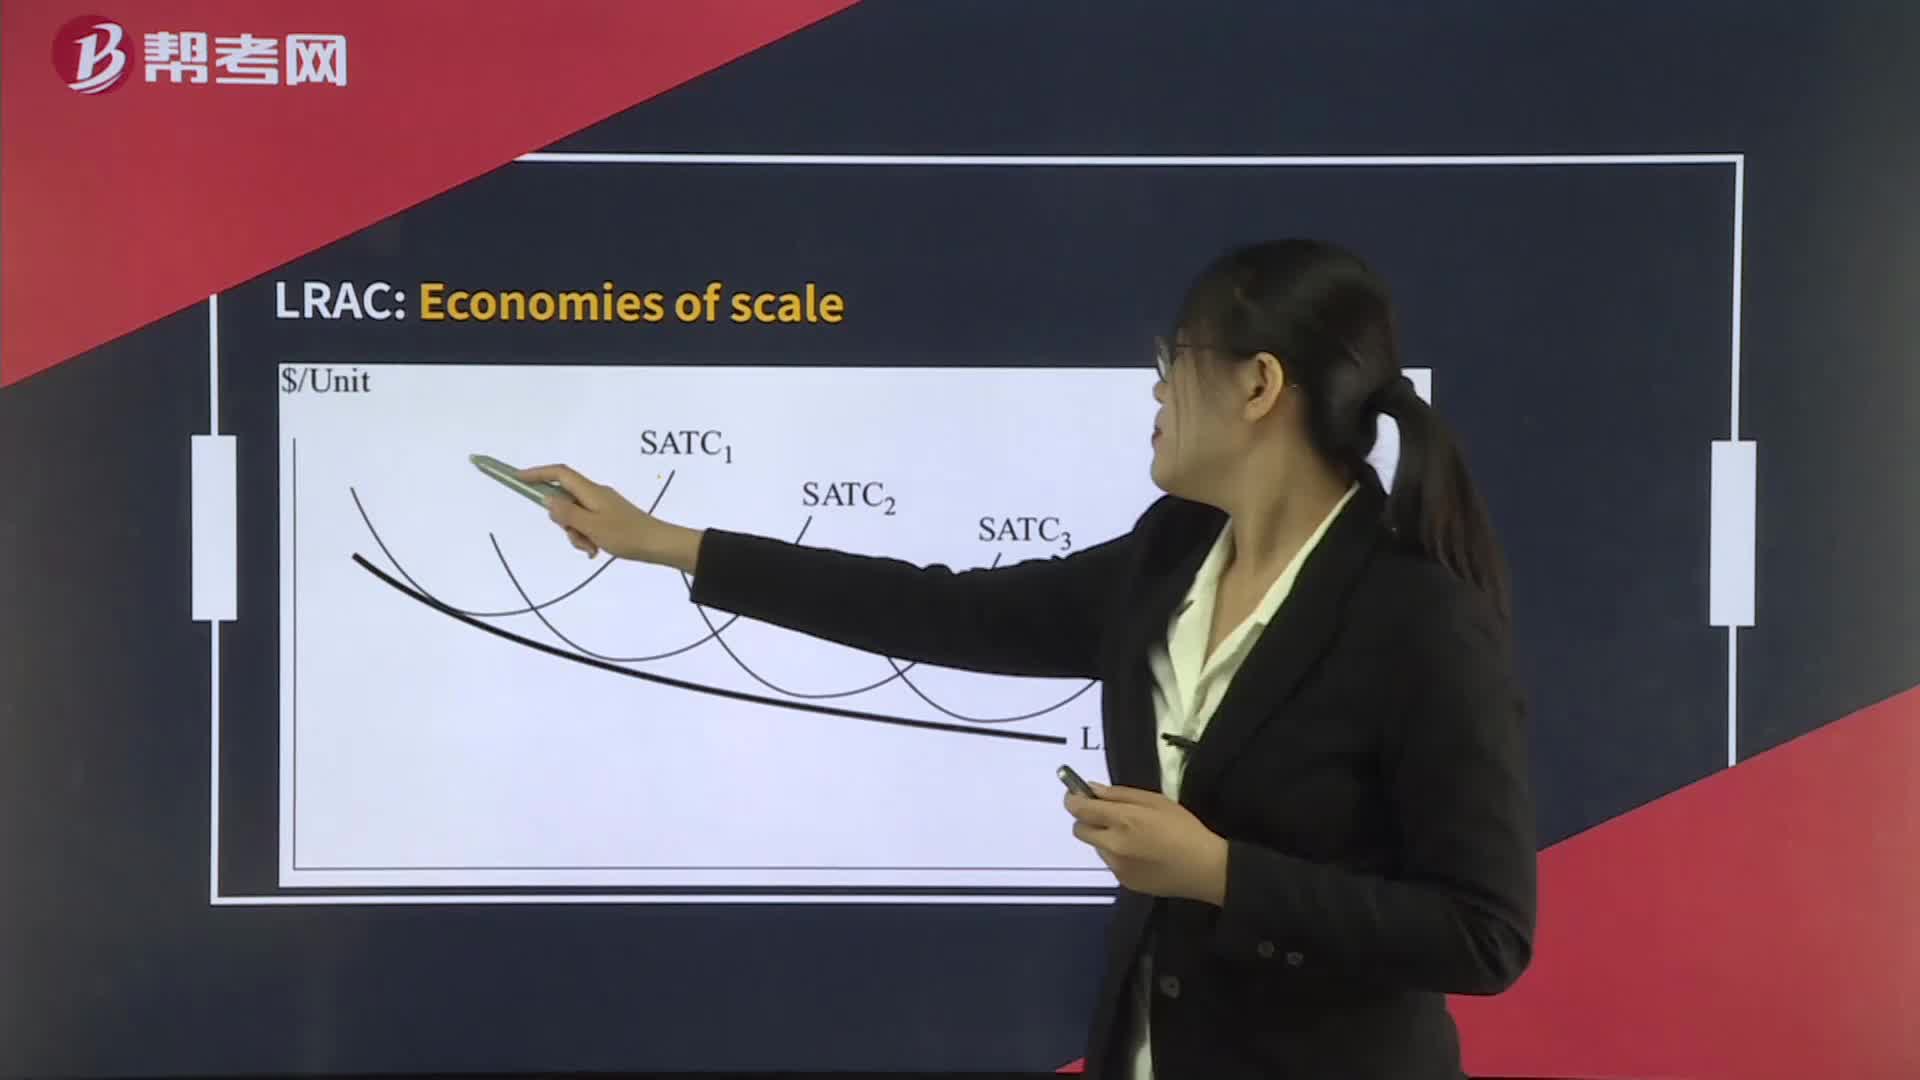
Economies of Scale and Diseconomies of Scale
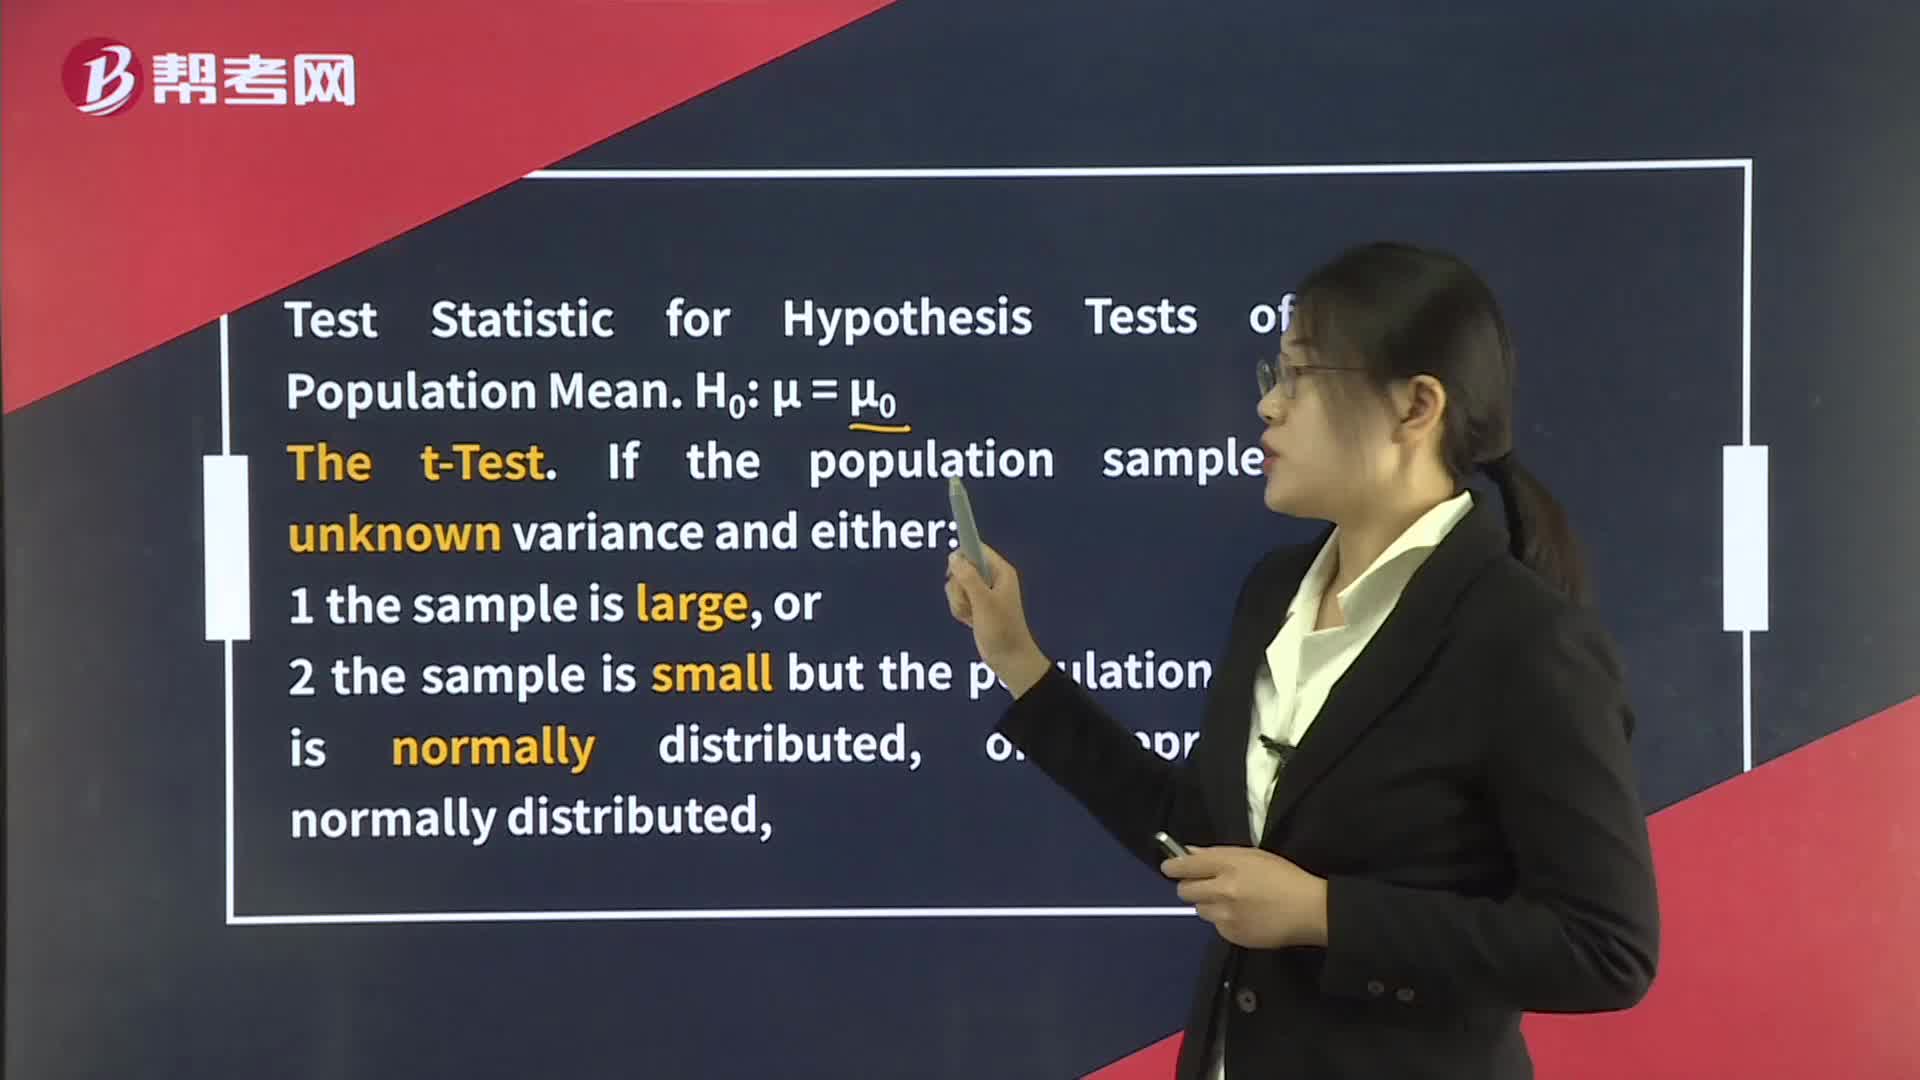
Hypothesis Tests Concerning the Mean