
CFA考試相關視頻
Technical Analysis Tools— Technical Indicators
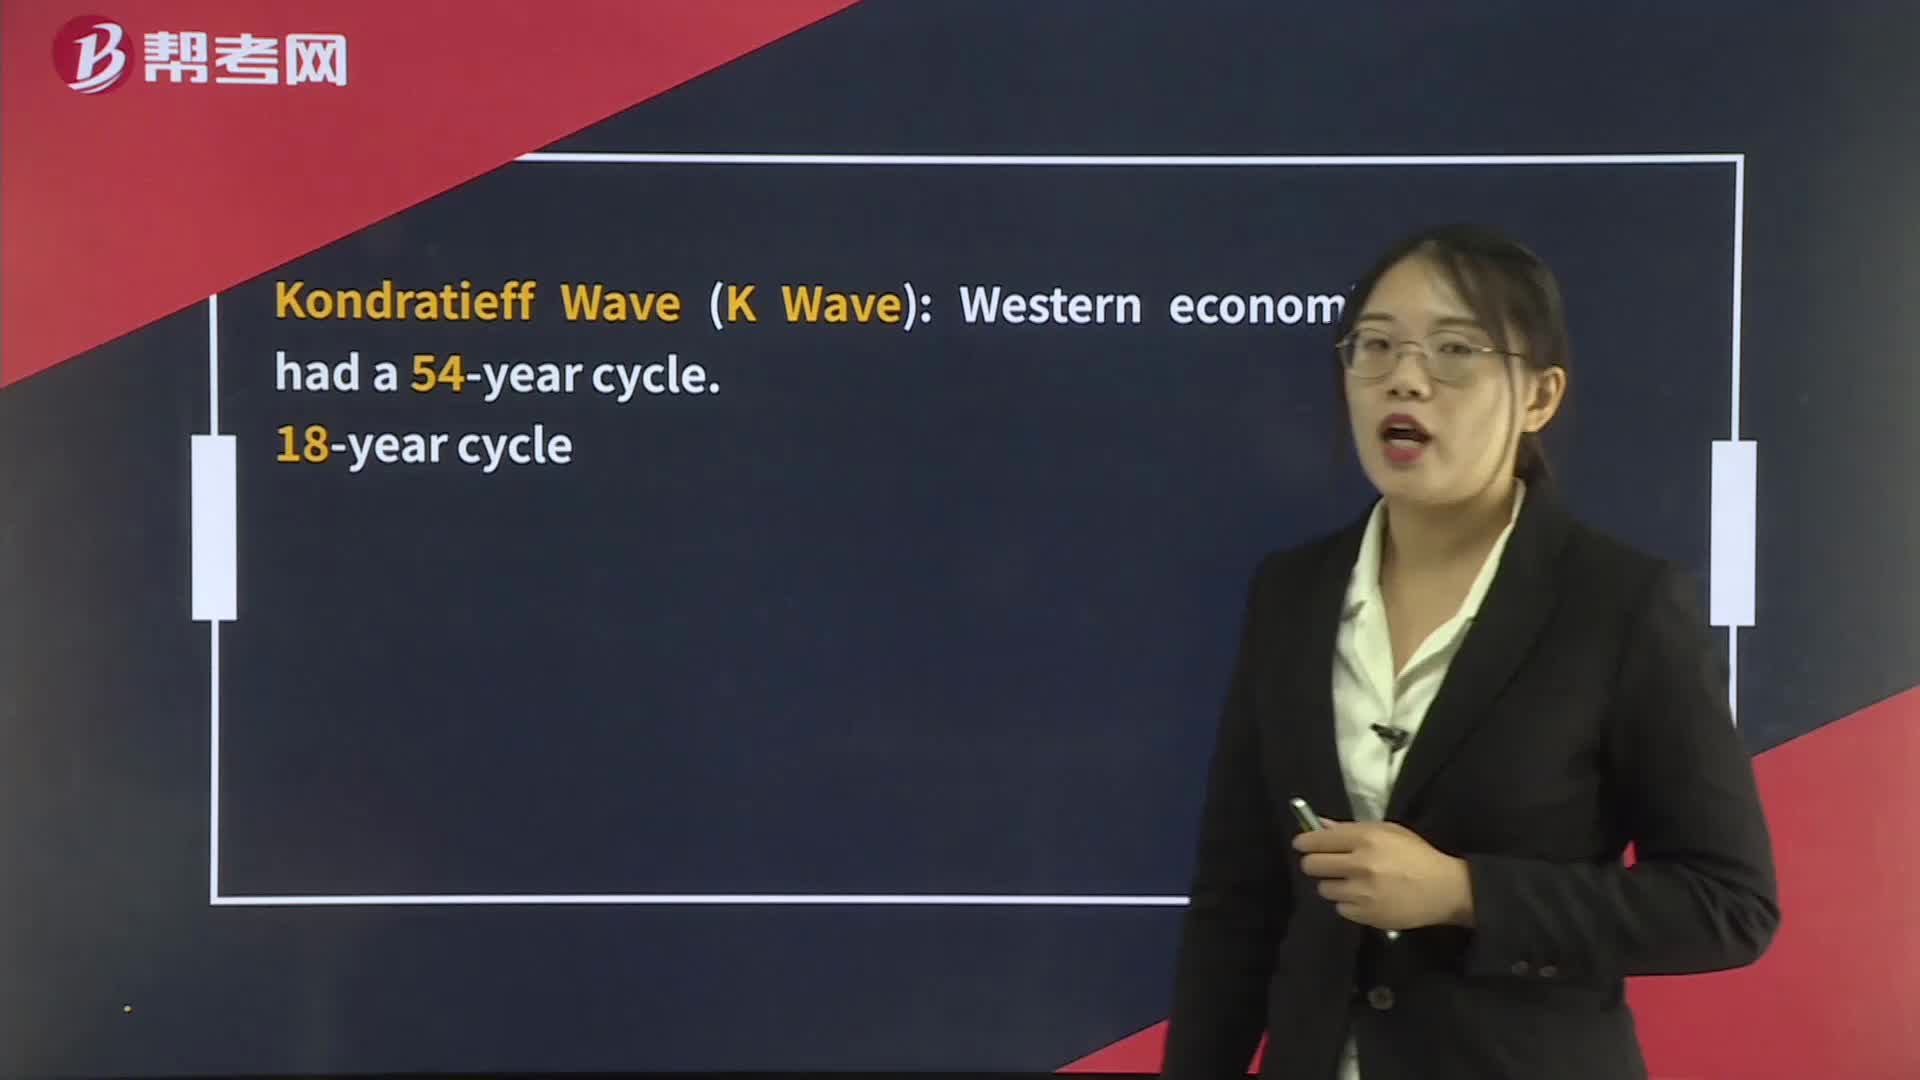
Technical Analysis Tools— Cycles
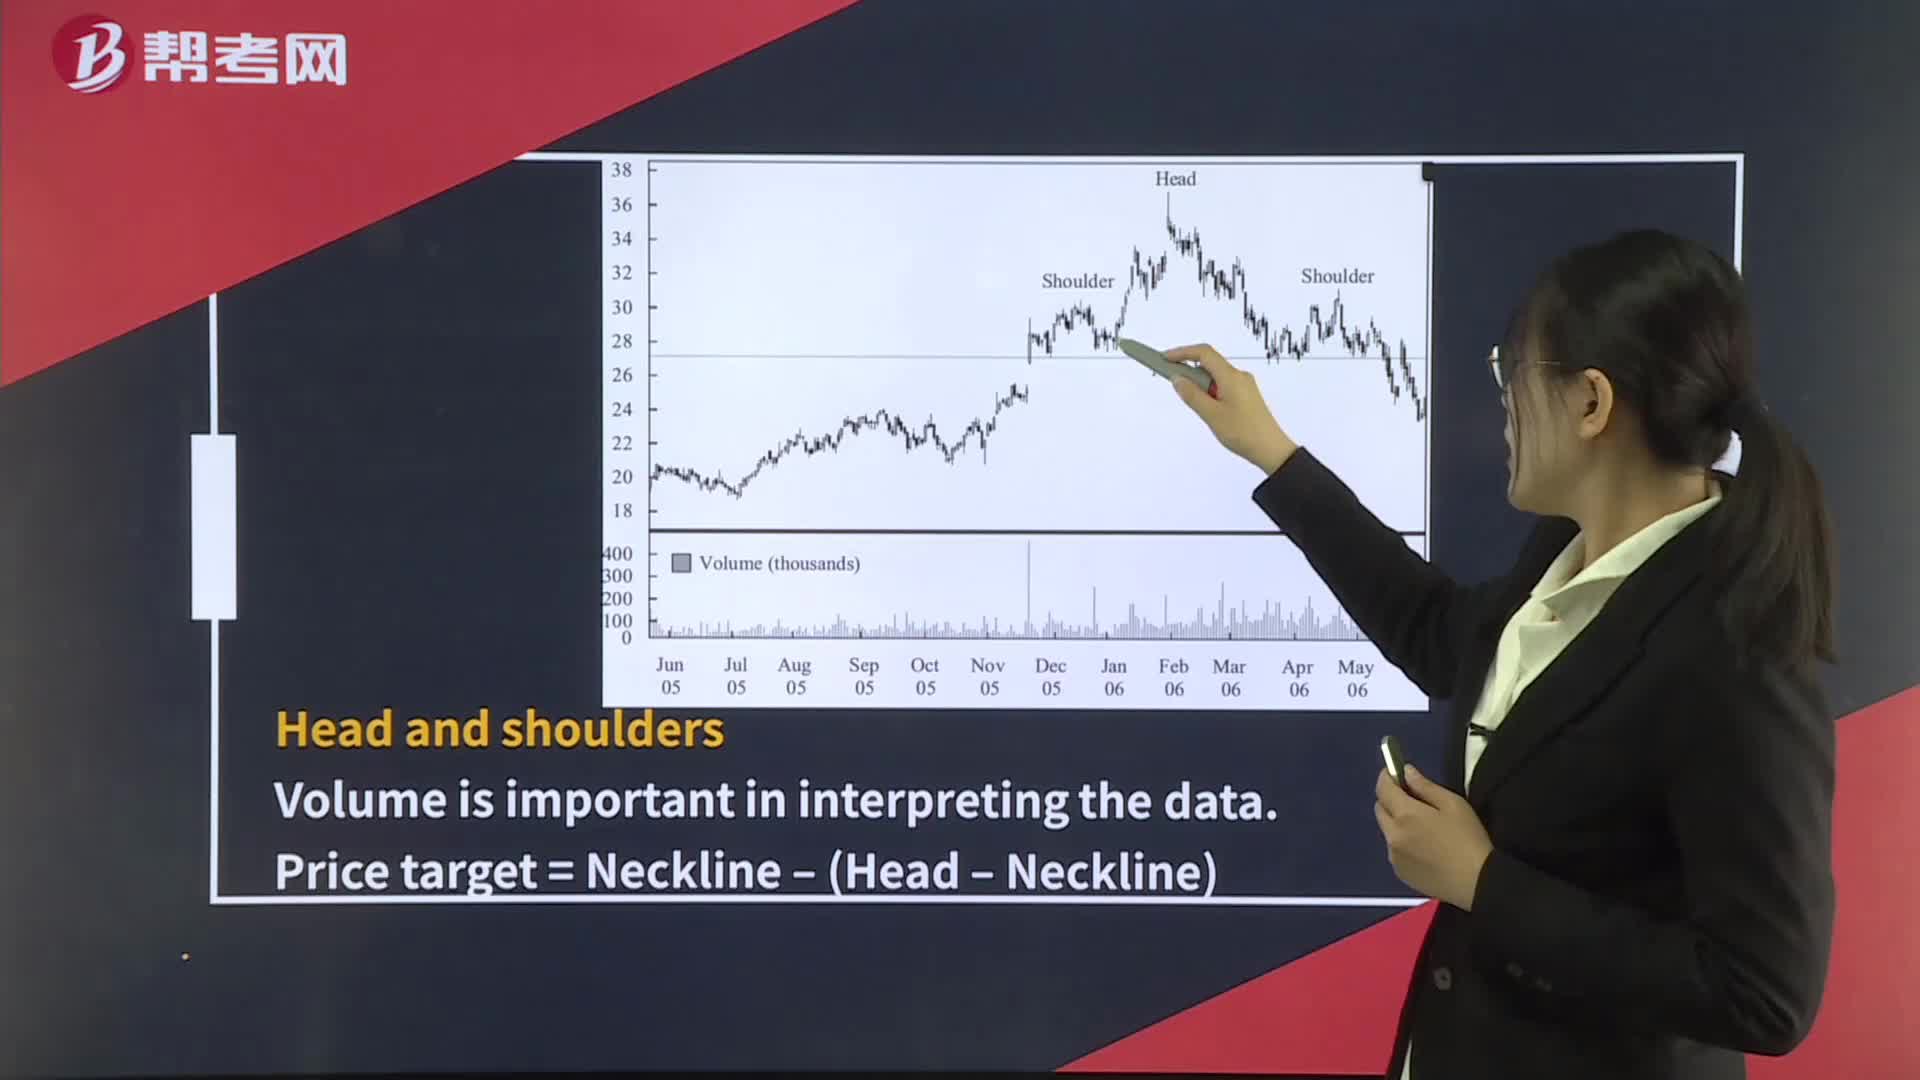
Technical Analysis Tools— Reversal Patterns
Technical Analysis Tools— Continuation Patterns
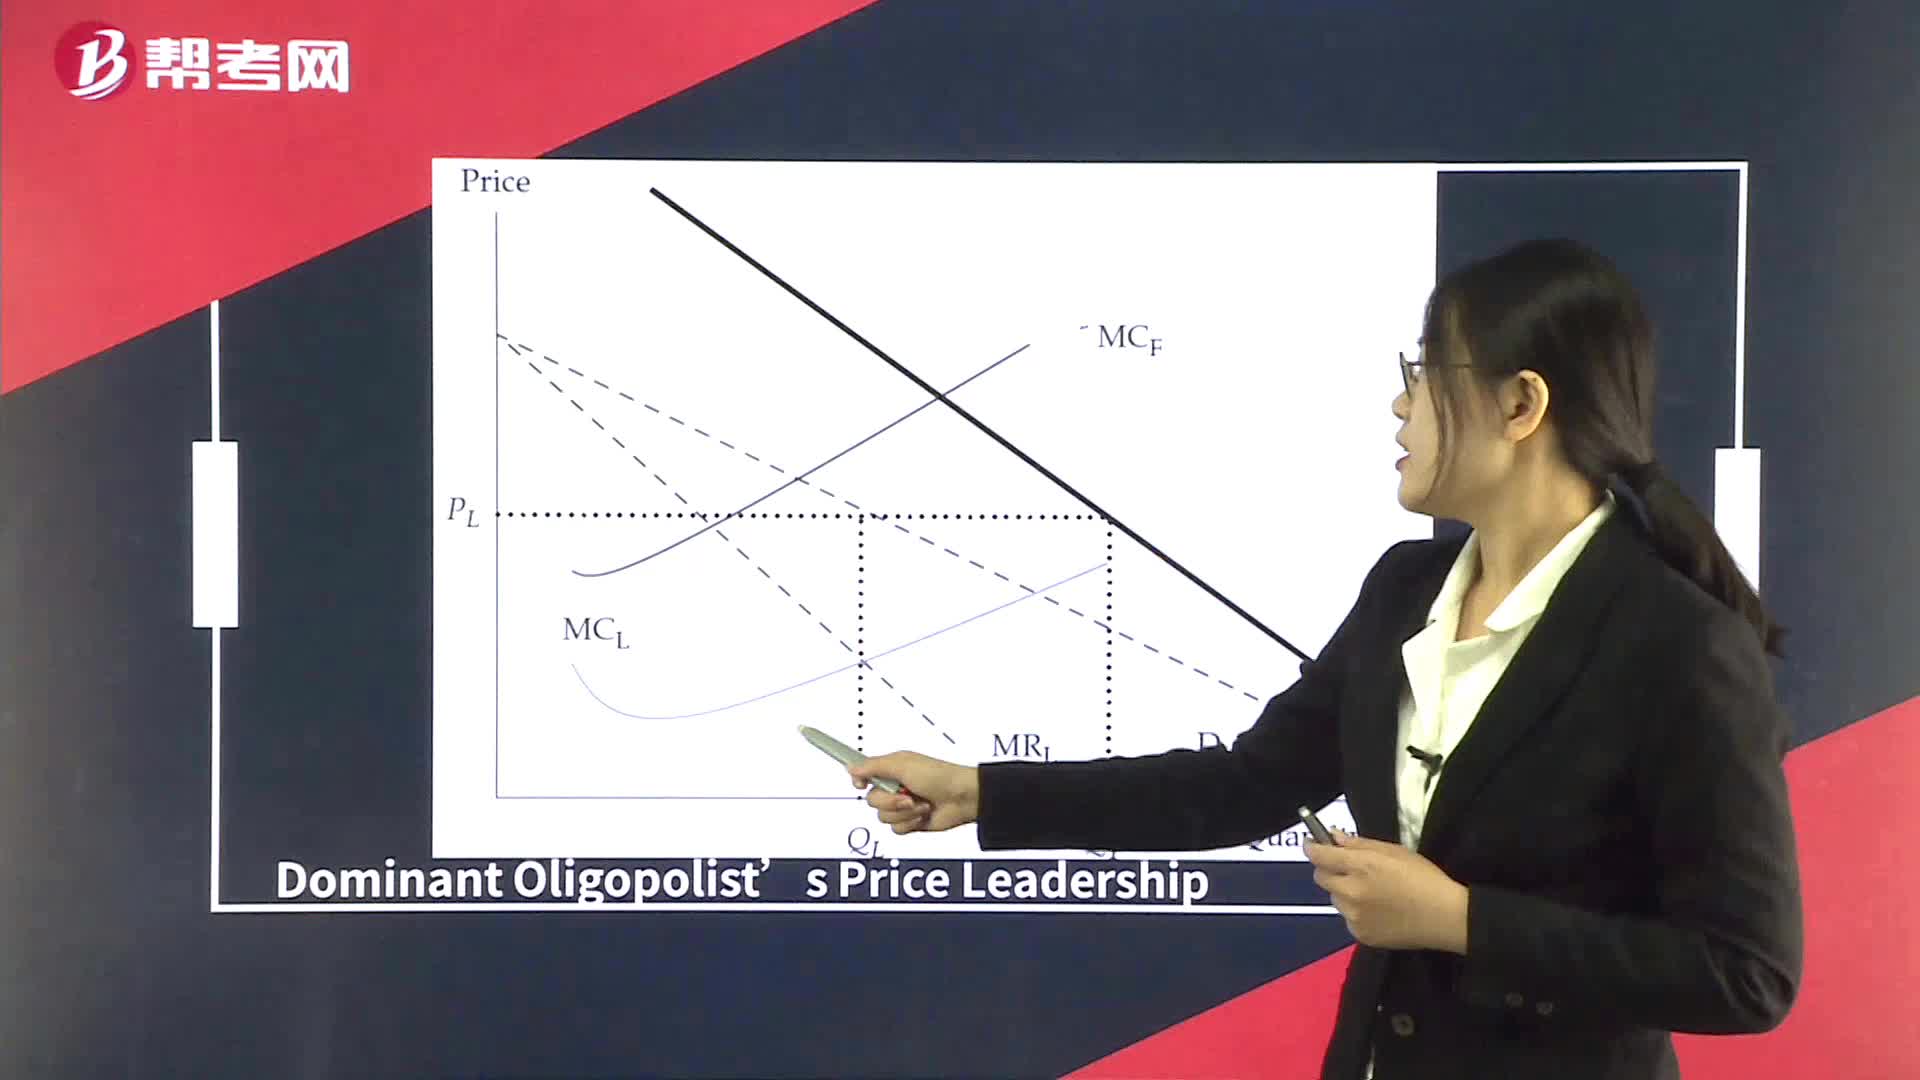
Supply Analysis in Oligopoly Market
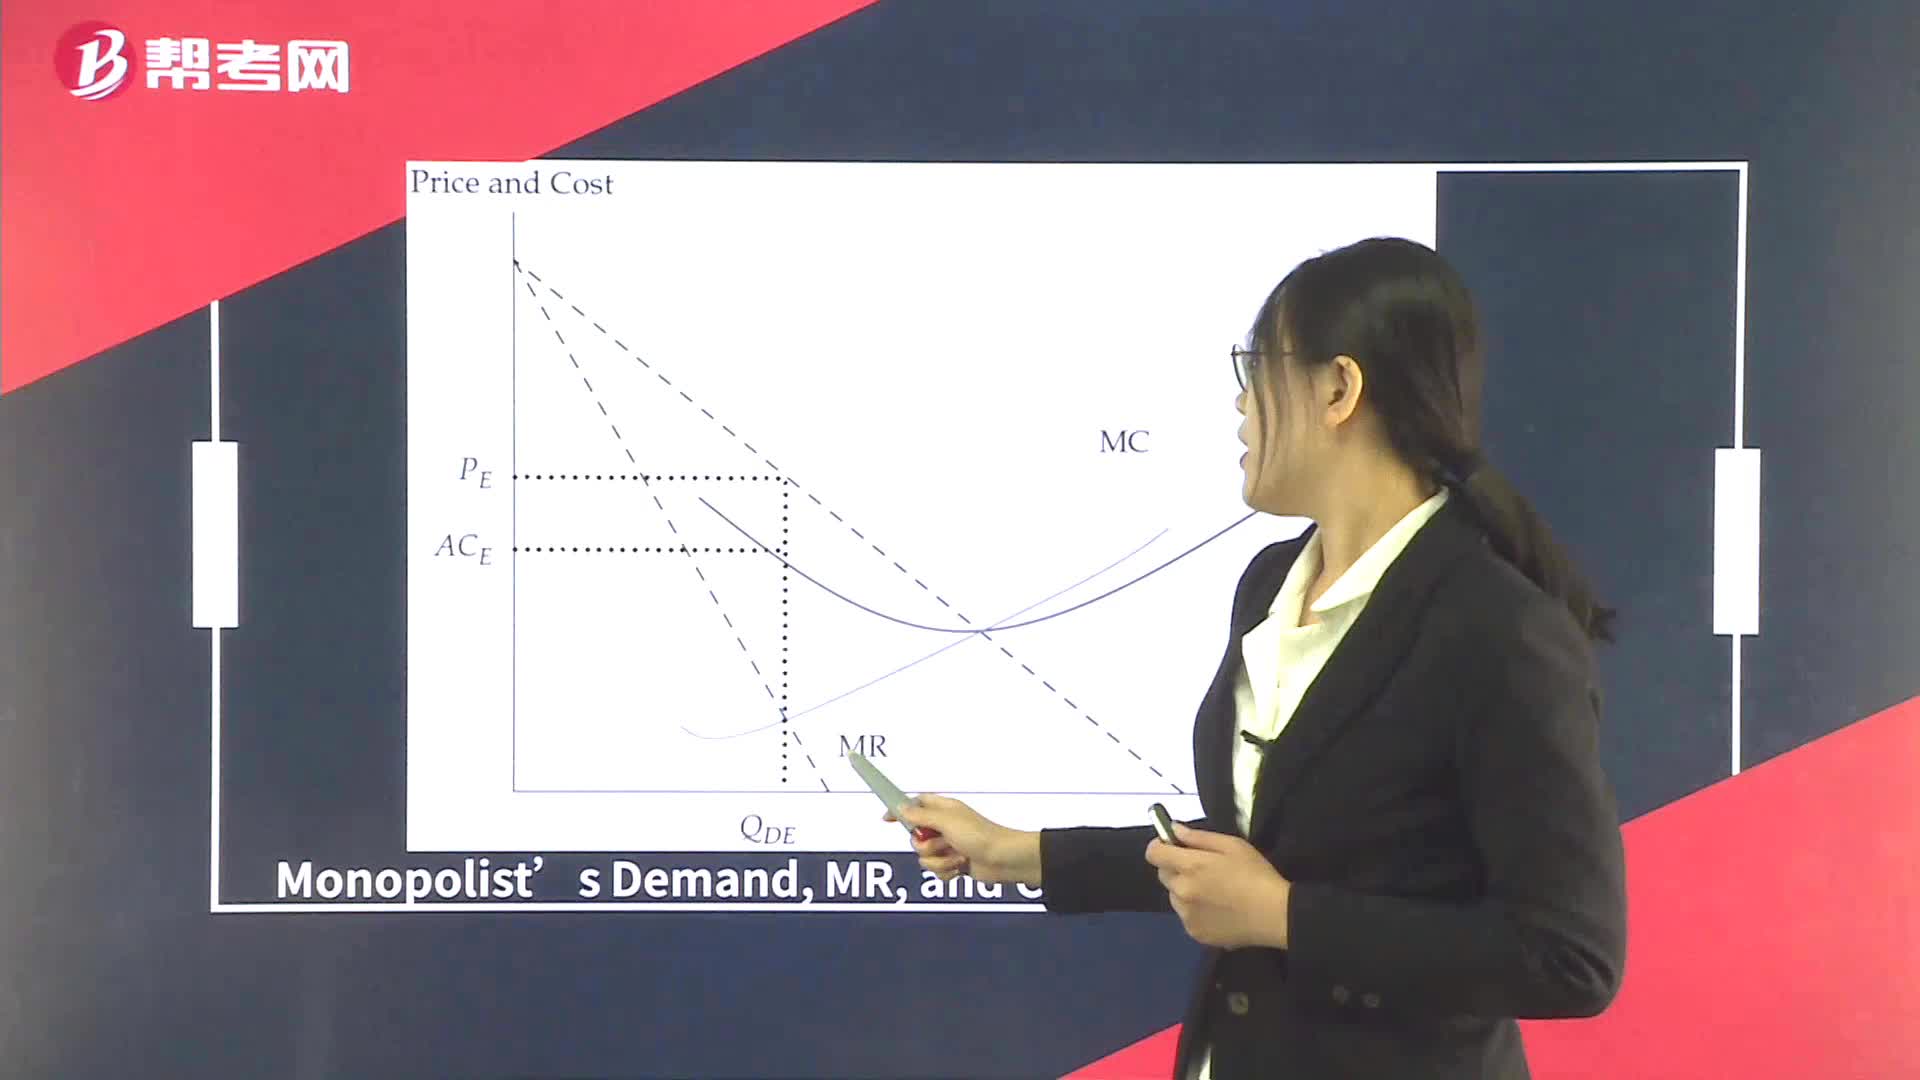
Supply Analysis in Monopoly
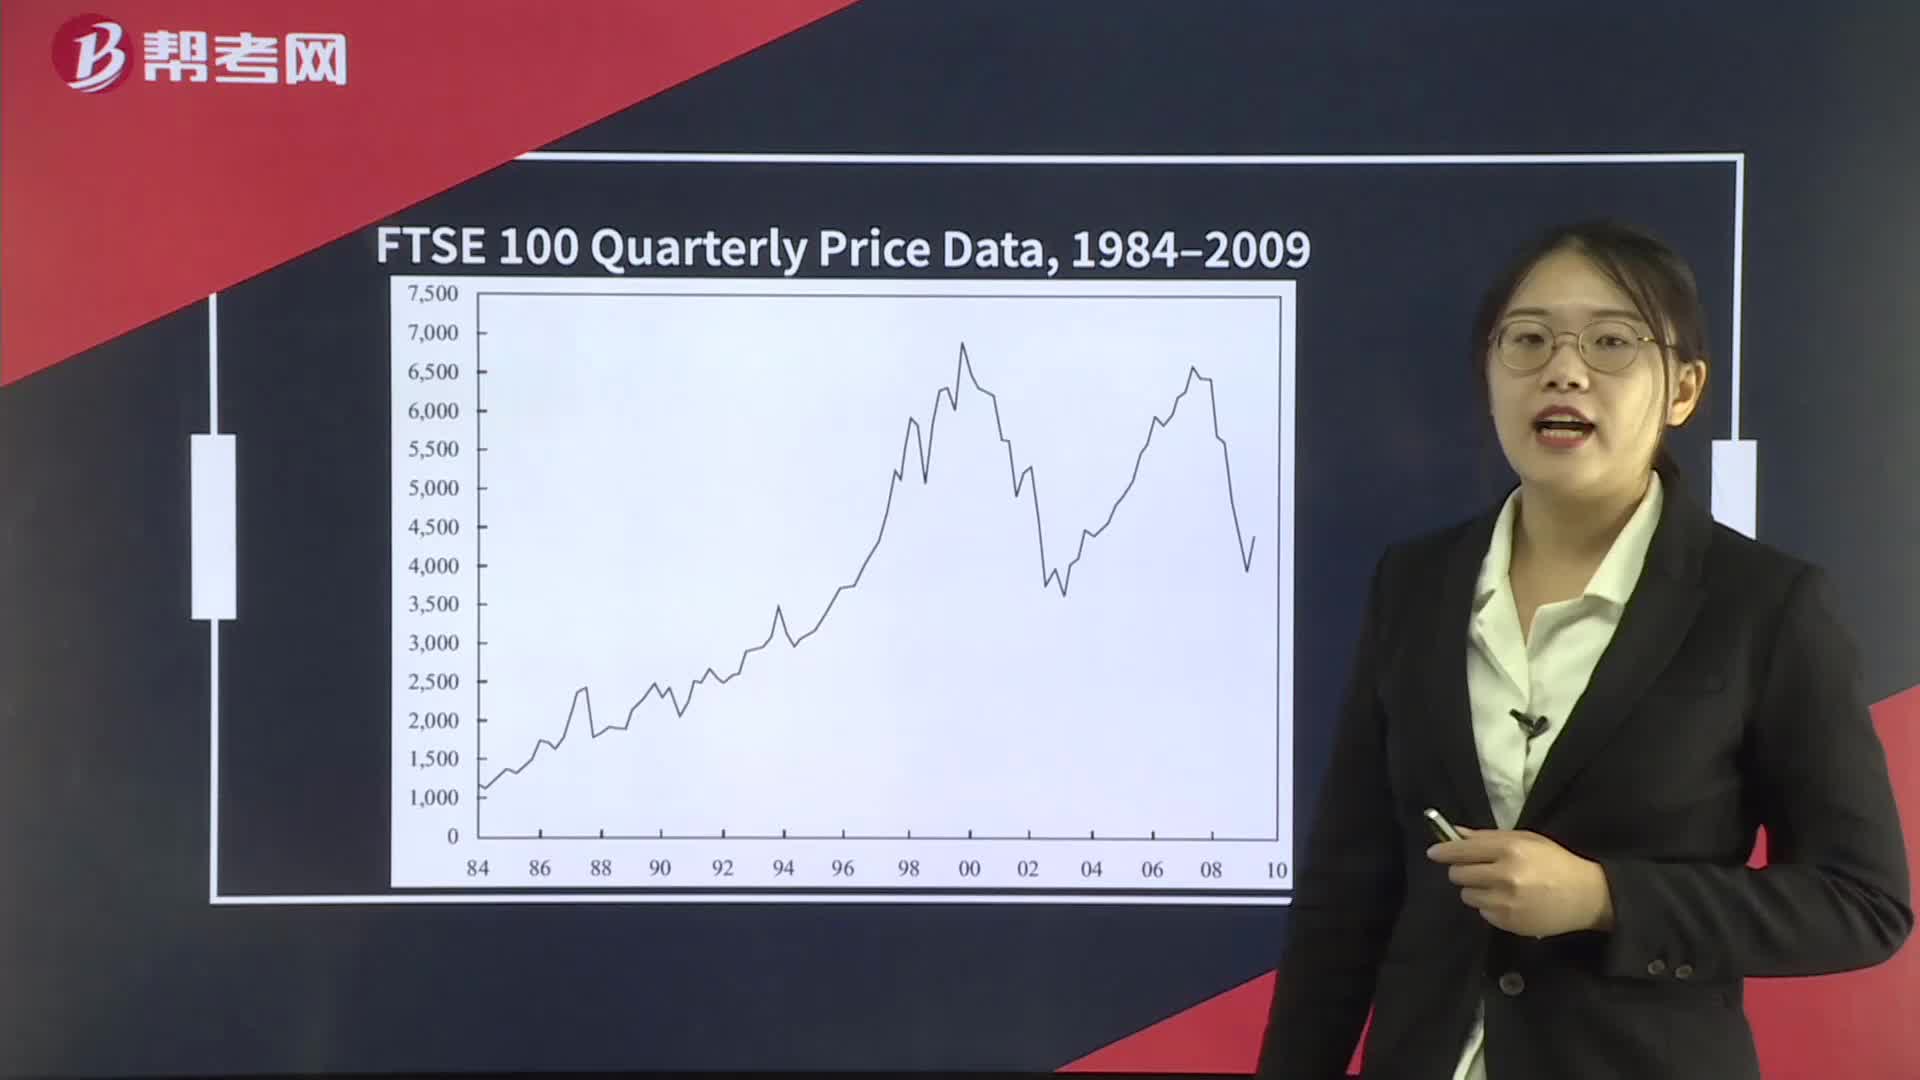
Technical Analysis Tools— Charts
Supply Analysis in Monopolistic Competition
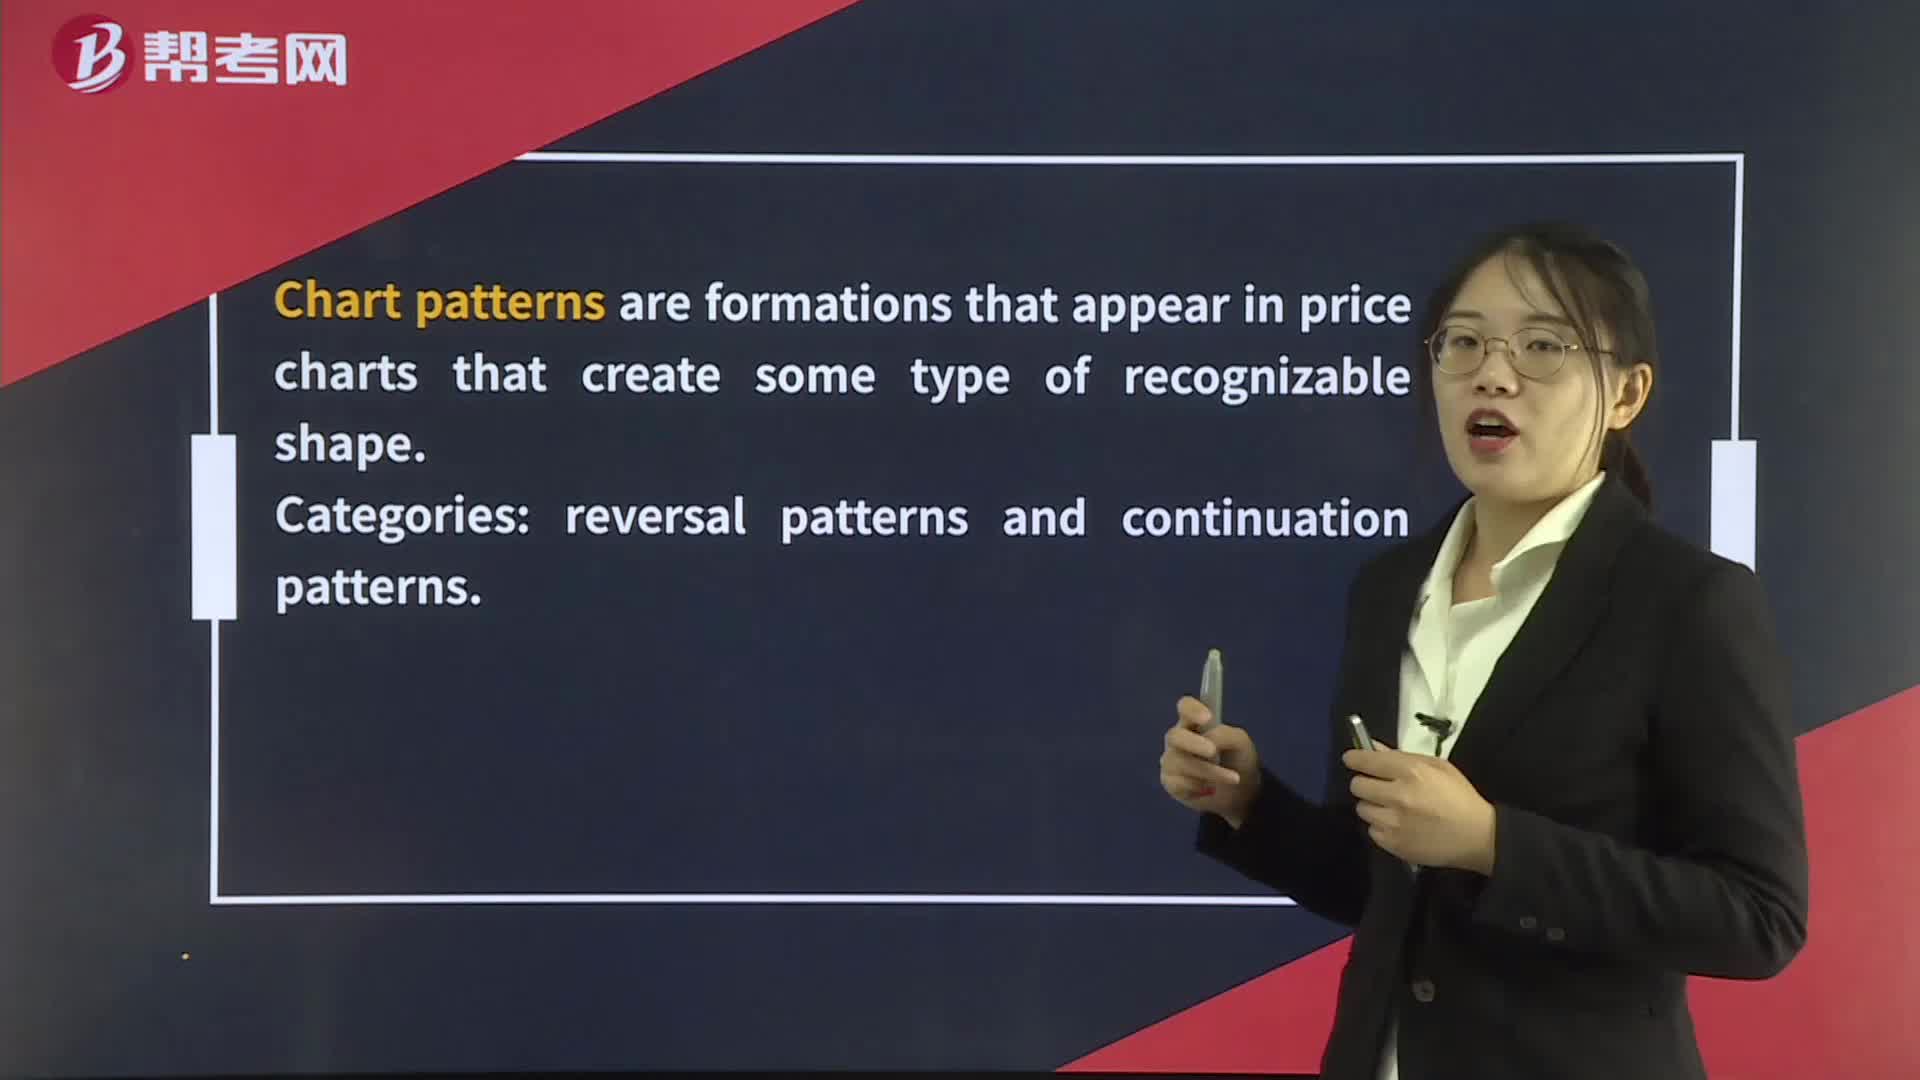
Technical Analysis Tools— Chart Patterns
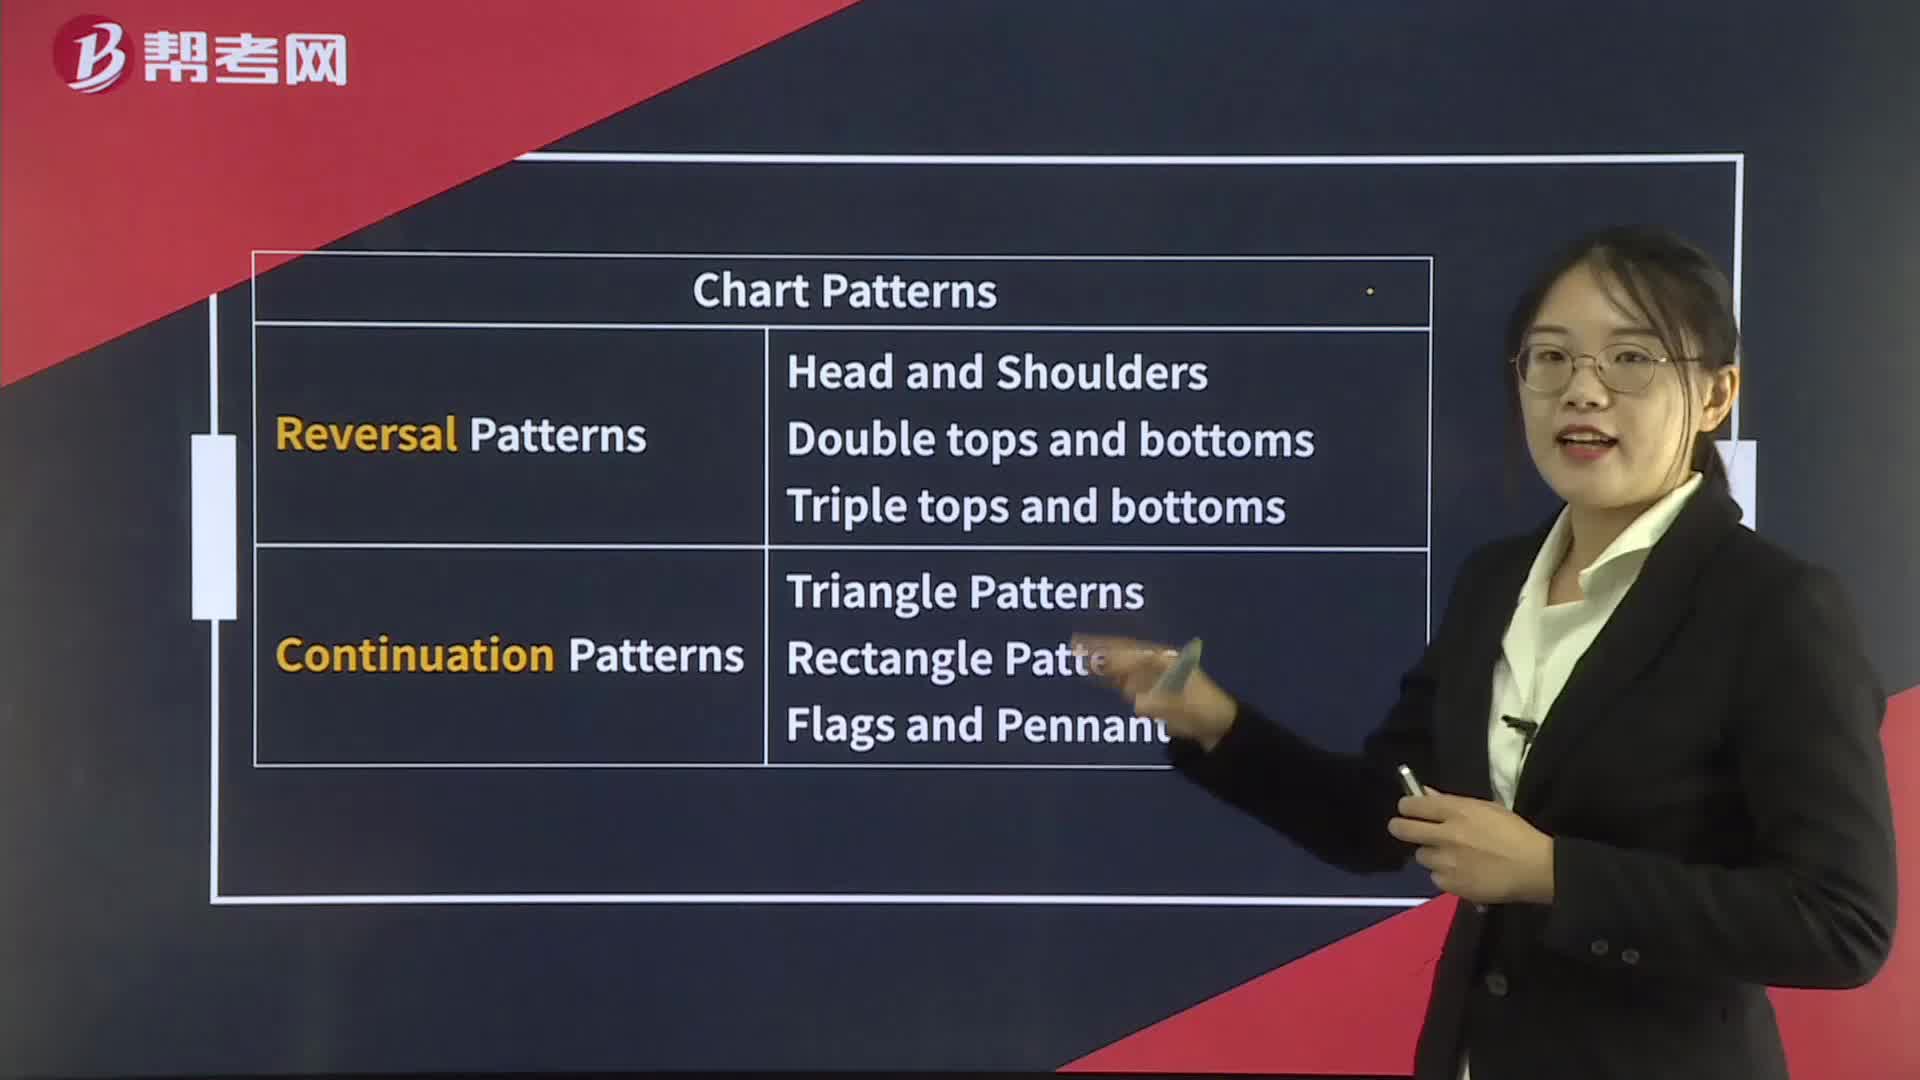
Technical Analysis Tools— Chart Patterns Summary
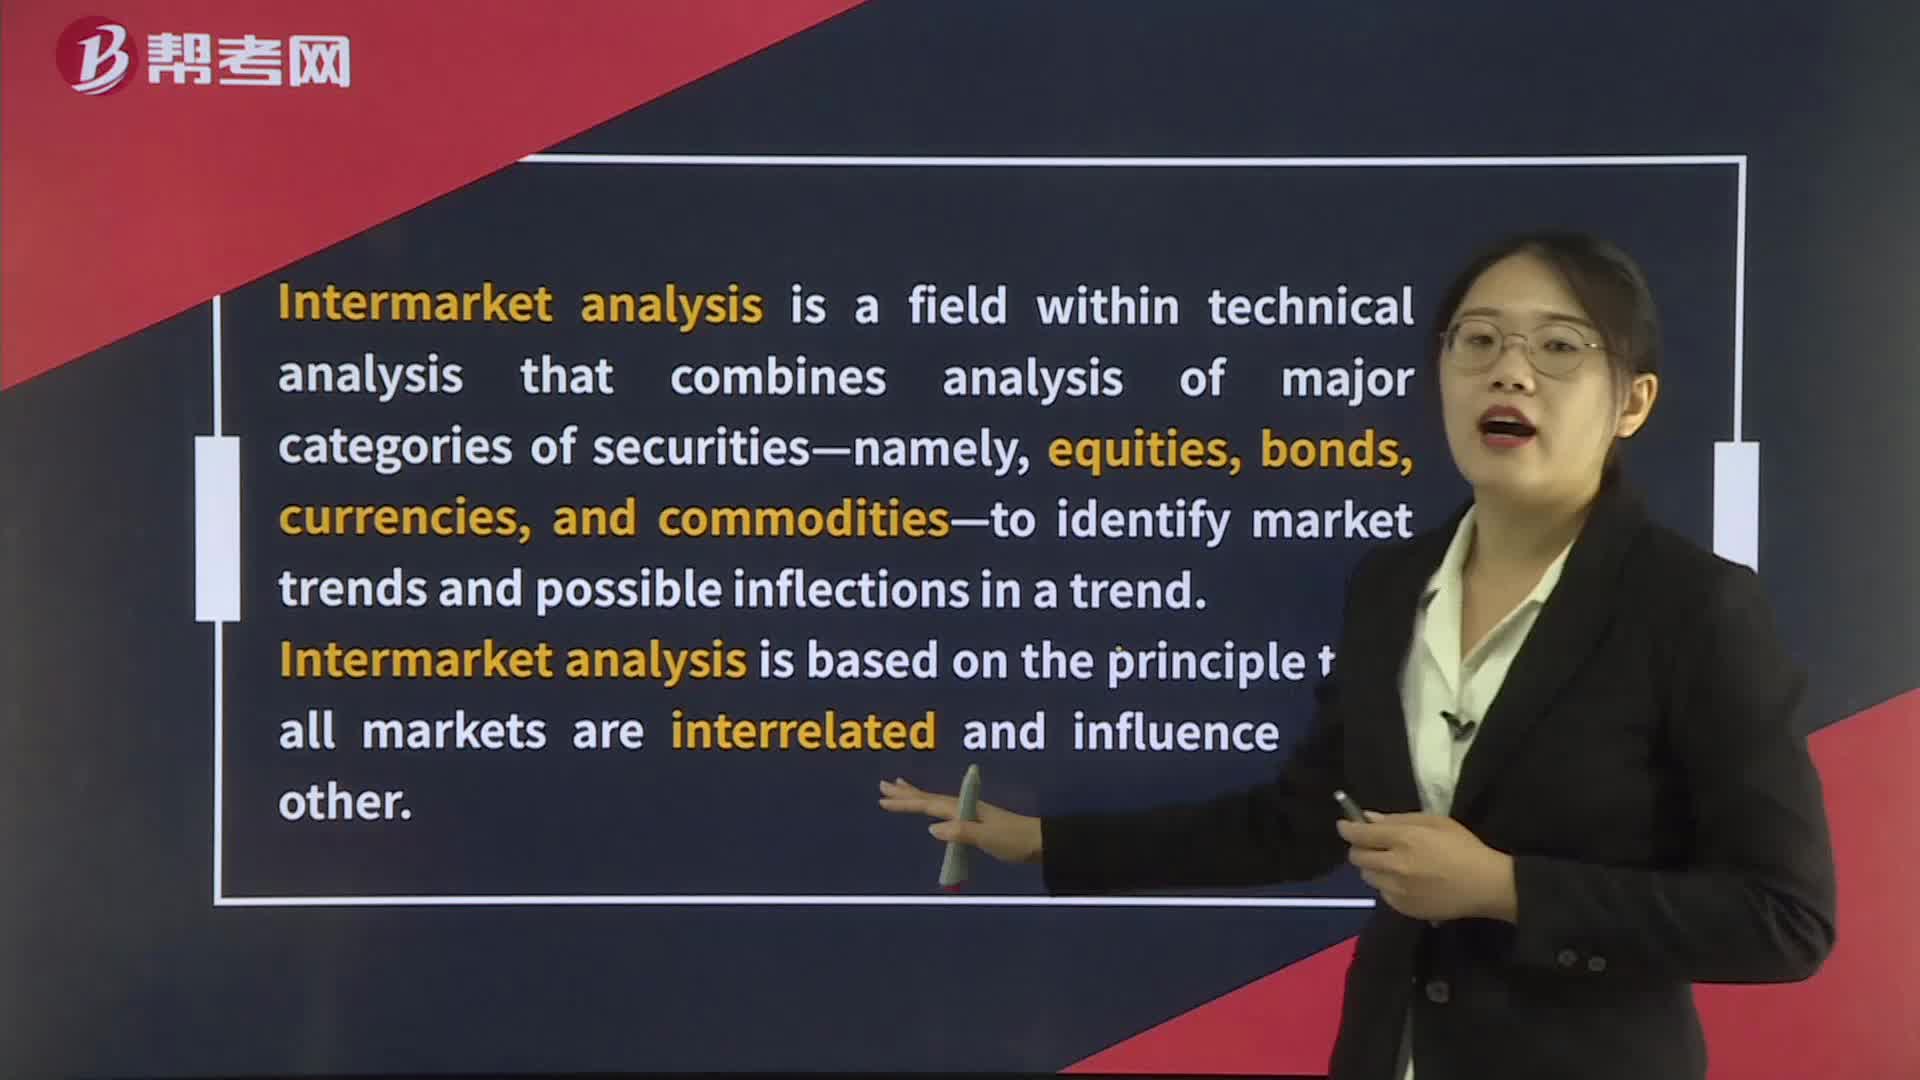
Intermarket analysis
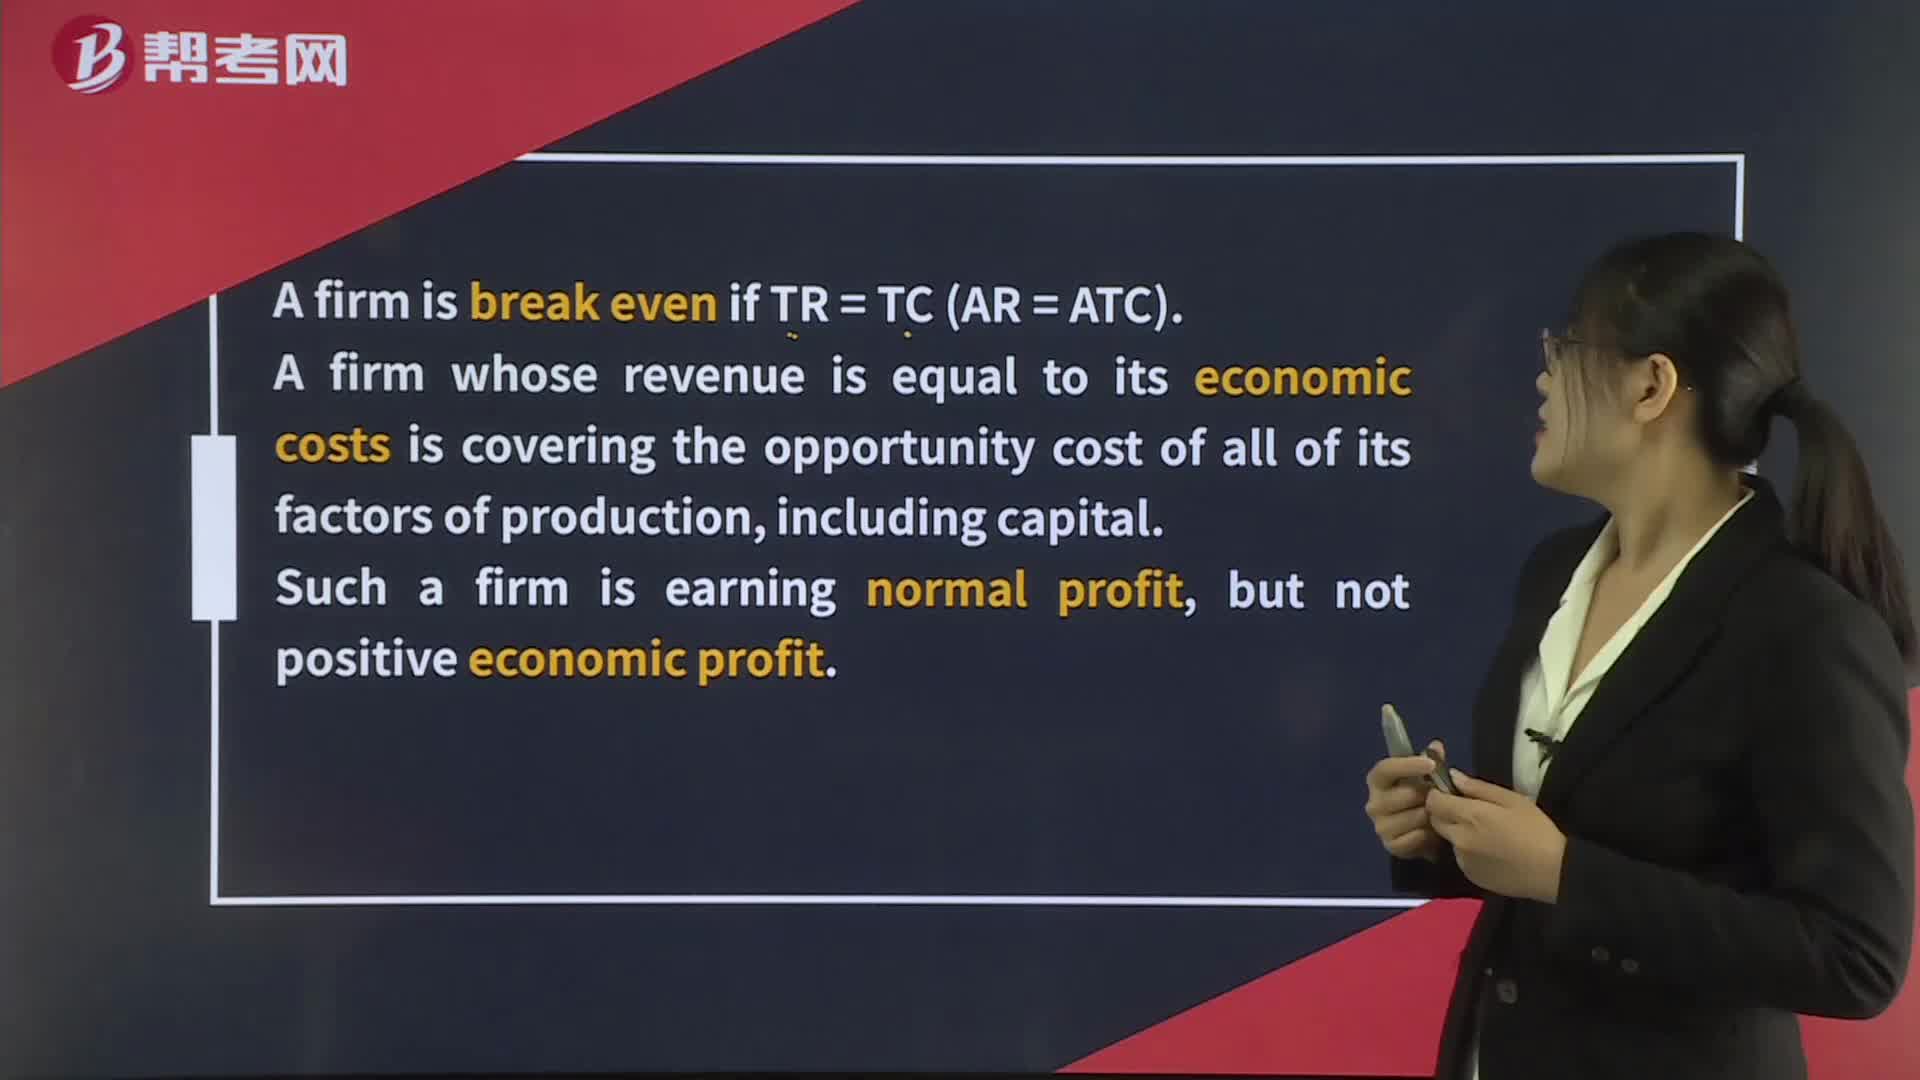
Breakeven Analysis